
UNITED STATES
SECURITIES AND EXCHANGE COMMISSION
Washington, D.C. 20549
FORM 6-K
REPORT OF FOREIGN PRIVATE ISSUER
PURSUANT TO RULE 13a-16 OR 15d-16 OF
THE SECURITIES EXCHANGE ACT OF 1934
For the month of February 2026
Commission File Number 001-36903
KORNIT DIGITAL LTD.
(Translation of Registrant’s name into English)
12 Ha’Amal Street
Park Afek
Rosh Ha’Ayin 4824096 Israel
(Address of Principal Executive Office)
Indicate by check mark whether the registrant files or will file annual reports under cover of Form 20-F or Form 40-F.
Form 20-F ☒ Form 40-F ☐
CONTENTS
Results of Operations and Financial Condition- Quarter and Year Ended December 31, 2025
On February 11, 2026, Kornit Digital Ltd. (“Kornit”) issued a press release entitled “Kornit Digital Reports Fourth Quarter and Full Year 2025 Results,” in which Kornit reported its results of operations for the fourth quarter and full year ended December 31, 2025. A copy of that press release is furnished as Exhibit 99.1 hereto.
Kornit is holding a conference call on February 11, 2026, to discuss its results for the quarter and full year ended December 31, 2025, and, in connection with that call, will make available to its investors a slide presentation to provide additional information regarding its business and its financial results. That slide presentation is attached as Exhibit 99.2 to this Report of Foreign Private Issuer on Form 6-K (this “Form 6-K”) and is incorporated herein by reference.
Exhibits
Incorporation by Reference
The U.S. GAAP financial information contained in the (i) consolidated balance sheets, (ii) consolidated statements of operations and (iii) consolidated statements of cash flows included in the press release attached as Exhibit 99.1 to this Report of Foreign Private Issuer on Form 6-K is hereby incorporated by reference into Kornit’s Registration Statements on Form S-8 (File No.’s 333-203970, 333-214015, 333-217039, 333-223794, 333-230567, 333-237346, 333-254749, 333-263975 and 333-286158).
1
SIGNATURES
Pursuant to the requirements of the Securities Exchange Act of 1934, the registrant has duly caused this report to be signed on its behalf by the undersigned, thereunto duly authorized.
| KORNIT DIGITAL LTD. | ||
| Date: February 11, 2026 | By: | /s/ Assaf Zipori |
| Name: | Assaf Zipori | |
| Title: | Chief Financial Officer | |
2
Exhibit 99.1

Kornit Digital Reports Fourth Quarter and Full Year 2025 Results
Returned to revenue growth in 2025 with positive adjusted EBITDA and operating cash flow
Successful peak season drives 11% increase in full-year impressions
Ended 2025 with ~$25 million in ARR from AIC; Building a more recurring, predictable business model
Rosh-Ha`Ayin, Israel – February 11, 2026 – Kornit Digital Ltd. (“Kornit” or the “Company”) (Nasdaq: KRNT), a global leader in sustainable, on-demand, digital fashion and textile production, today reported financial results for the fourth quarter and full year ended December 31, 2025. The results reflect Kornit’s progress in accelerating digital adoption in mass apparel production, expanding recurring revenues under the Company’s All-Inclusive Click (AIC) model, and strengthening its industry leadership position by replacing traditional screen printing with agile, on-demand digital solutions.
“The fourth quarter capped a year of disciplined execution. We returned to full-year revenue growth, achieved positive adjusted EBITDA, and generated strong operating cash flow,” said Ronen Samuel, Chief Executive Officer of Kornit Digital. “A successful peak season helped drive full year impressions growth of 11%, demonstrating higher utilization across our installed base and increased adoption of digital production for longer runs. We exited the year with approximately $25 million in Annualized Recurring Revenue (ARR) from our All-Inclusive Click (AIC) program, and $15 million in AIC revenue for the full year, underscoring accelerating customer adoption.”
Mr. Samuel concluded, “We are entering 2026 with a growing pipeline of opportunities, and better visibility for the year. We expect to unveil breakthrough innovations this year designed to expand our addressable markets, accelerate digital adoption, and enable our customers to capture new growth opportunities. Our priorities remain clear: driving incremental impressions from the screen market, expanding the AIC program, and delivering on our innovation roadmap to support growth beyond 2026.”
Fourth Quarter 2025 Results of Operations
| ● | Total revenue for the fourth quarter of 2025 was $58.9 million compared with $60.7 million in the prior year period. |
| ● | GAAP gross profit margin for the fourth quarter of 2025 was 48.7% compared with 51.3% in the prior year period. On a non-GAAP basis, gross profit margin was 50.7% compared with 55.1% in the prior year period. |
| ● | GAAP operating expenses for the fourth quarter of 2025 were $32.2 million compared with $32.3 million in the prior year period. On a non-GAAP basis, operating expenses decreased by 3.1% to $27.1 million compared with the prior year period. |
| ● | GAAP net income for the fourth quarter of 2025 was $1.7 million, or $0.03 per diluted share, compared with net income of $2.2 million, or $0.05 per diluted share, in the prior year period. |
| ● | Non-GAAP net income for the fourth quarter of 2025 was $8.3 million, or $0.18 per diluted share, compared with non-GAAP net income of $8.7 million, or $0.18 per diluted share in the prior year period. |
| ● | Adjusted EBITDA for the fourth quarter of 2025 was $5.5 million compared with adjusted EBITDA of $8.4 million for the fourth quarter of 2024. Adjusted EBITDA margin for the fourth quarter of 2025 was 9.3% compared with 13.8% in the prior year period. |
Full Year 2025 Results of Operations
| ● | Total revenue for the full year 2025 was $208.2 million compared with $203.8 million in the prior year period. |
| ● | GAAP gross profit margin for the full year 2025 was 44.3% compared with 45.0% in the prior year period. On a non-GAAP basis, gross profit margin was 47.2% compared with 48.6% in the prior year period. |
| ● | GAAP operating expenses for the full year 2025 were $126.8 million compared with $129.1 million in the prior year. On a non-GAAP basis, operating expenses decreased by 2.5% to $107.1 million compared with the prior year period. |
| ● | GAAP net loss for the full year 2025 was $13.5 million, or ($0.30) per diluted share, compared with net loss of $16.8 million, or ($0.35) per diluted share, for the full year 2024. |
| ● | Non-GAAP net income for the full year 2025 was $14.4 million, or $0.31 per diluted share, compared with non-GAAP net income of $10.1 million, or $0.20 per diluted share for the full year 2024. |
| ● | Adjusted EBITDA for the full year 2025 was $1.5 million compared with adjusted EBITDA of $0.3 million for the full year 2024. Adjusted EBITDA margin for the full year 2025 was 0.7% compared with 0.2% for the full year 2024. |
First Quarter 2026 Guidance
For the first quarter of 2026, the Company currently expects revenues to be in the range of $45 million to $49 million and an adjusted EBITDA margin between negative 10% to negative 4% of revenue.
Earnings Conference Call Information
The Company will host a conference call today, February 11, 2026, at 8:30 a.m. ET, or 3:30 p.m. Israel time, to discuss the results, followed by a question-and-answer session with the investor community.
A live webcast of the call can be accessed at ir.kornit.com. To access the call, participants may dial toll-free at 1-877-407-0792 or 1-201-689-8263. The toll-free Israeli number is 1 809 406 247.
To listen to a replay of the conference call, dial toll-free 1-844-512-2921 or 1-412-317-6671 and enter confirmation code 13758004. The telephone replay will be available approximately three hours after the completion of the live call until 11:59 pm ET on February 25, 2026. The call will also be available for replay via the webcast link on Kornit’s Investor Relations website.
2
About Kornit Digital
Kornit Digital (NASDAQ: KRNT) is a worldwide market leader in sustainable, on-demand, digital fashion and textile production technologies. The Company offers end-to-end solutions including digital printing systems, inks, consumables, software, and fulfillment services through its global fulfillment network. Headquartered in Israel with offices in the USA, Europe, and Asia Pacific, Kornit Digital serves customers in more than 100 countries. To learn more, visit www.kornit.com.
Forward Looking Statements
Certain statements in this press release are “forward-looking statements” within the meaning of the Private Securities Litigation Reform Act of 1995 and other U.S. securities laws. Forward-looking statements are characterized by the use of forward-looking terminology such as “will,” “expects,” “anticipates,” “believes,” “intends,” “planned,” or other similar words. These forward-looking statements include, but are not limited to, statements relating to the Company’s objectives, plans and strategies, including the Company’s AIC program, statements regarding the Company’s results of operations and financial condition, including the Company’s guidance for the first quarter of 2026, and all statements that address developments that the Company expects or anticipates will or may occur in the future. Forward-looking statements are not guarantees of future performance and are subject to risks and uncertainties. The Company has based these forward-looking statements on assumptions and assessments made by its management in light of their experience and their perception of historical trends, current conditions, expected future developments and other factors they believe to be appropriate. Important factors that could cause actual results, developments and business decisions to differ materially from those anticipated in these forward-looking statements include, among other things: the Company’s degree of success in developing, introducing and selling new or improved products and product enhancements including specifically the Company’s Poly Pro and Presto products, and the Company’s Apollo direct-to-garment platform; the extent of the Company’s ability to increase sales of its systems, ink and consumables; the extent of the Company’s ability to continue to grow customer adoption of the AIC model; the development of the market for digital textile printing generally; the Company’s securities class action litigation expenses; and those additional factors referred to under “Risk Factors” in Item 3.D of the Company’s Annual Report on Form 20-F for the year ended December 31, 2024, filed with the SEC on March 28, 2025. Any forward-looking statements in this press release are made as of the date hereof, and will not be updated by the Company, whether as a result of new information, future events or otherwise, except as required by law.
Non-GAAP Discussion Disclosure
The Company presents certain non-GAAP financial measures, in this press release and in the accompanying conference call to discuss the Company’s quarterly results. These non-GAAP financial measures reflect adjustments to corresponding GAAP financial measures in order to exclude the impact of the following: share-based compensation expenses; amortization of intangible assets; restructuring expenses; foreign exchange differences associated with ASC 842; and non-cash deferred tax income.
The Company defines “Adjusted EBITDA” as non-GAAP operating income (loss), which reflects the adjustments described in the preceding paragraph to the Company’s GAAP net income (loss), as further adjusted to exclude depreciation expense.
3
The purpose of the foregoing non-GAAP financial measures is to convey the Company’s performance exclusive of non-cash charges and other items that are considered by management to be outside of the Company’s core operating results. These non-GAAP measures are among the primary factors management uses in planning for and forecasting future periods. Furthermore, the non-GAAP measures are regularly used internally to understand, manage, and evaluate the Company’s business and make operating decisions, and the Company believes that they are useful to investors as a consistent and comparable measure of the ongoing performance of the Company’s business. The Company’s non-GAAP financial measures are not meant to be considered in isolation or as a substitute for comparable GAAP measures and should be read only in conjunction with the Company’s consolidated financial statements prepared in accordance with GAAP. Additionally, these non-GAAP financial measures may differ materially from the non-GAAP financial measures used by other companies.
The reconciliation tables included below present a reconciliation of our non-GAAP financial measures to the most directly comparable GAAP financial measures.
Investor Contacts
Andrew G. Backman
Chief Capital Markets Officer
Andrew.Backman@kornit.com
4
KORNIT DIGITAL LTD.
AND ITS SUBSIDIARIES
CONSOLIDATED BALANCE SHEETS
(U.S. dollars in thousands)
| December
31, 2025 | December
31, 2024 | |||||||
| (Unaudited) | (Audited) | |||||||
| ASSETS | ||||||||
| CURRENT ASSETS: | ||||||||
| Cash and cash equivalents | $ | 35,476 | $ | 35,003 | ||||
| Short-term bank deposit | 368,446 | 205,934 | ||||||
| Marketable securities | 53,926 | 222,937 | ||||||
| Trade receivables, net | 60,796 | 65,459 | ||||||
| Inventory | 47,211 | 60,342 | ||||||
| Other accounts receivable and prepaid expenses | 29,661 | 25,714 | ||||||
| Total current assets | 595,516 | 615,389 | ||||||
| LONG-TERM ASSETS: | ||||||||
| Marketable securities | 33,332 | 48,086 | ||||||
| Deposits and other long-term assets | 16,018 | 10,542 | ||||||
| Severance pay fund | 385 | 306 | ||||||
| Property,plant and equipment, net | 69,492 | 59,222 | ||||||
| Operating lease right-of-use assets | 17,174 | 19,054 | ||||||
| Intangible assets, net | 9,429 | 5,721 | ||||||
| Goodwill | 29,164 | 29,164 | ||||||
| Total long-term assets | 174,994 | 172,095 | ||||||
| Total assets | 770,510 | 787,484 | ||||||
| LIABILITIES AND SHAREHOLDERS' EQUITY | ||||||||
| CURRENT LIABILITIES: | ||||||||
| Trade payables | 6,059 | 9,019 | ||||||
| Employees and payroll accruals | 13,214 | 13,101 | ||||||
| Deferred revenues and advances from customers | 1,529 | 2,339 | ||||||
| Operating lease liabilities | 3,886 | 3,311 | ||||||
| Other payables and accrued expenses | 17,305 | 16,561 | ||||||
| Total current liabilities | 41,993 | 44,331 | ||||||
| LONG-TERM LIABILITIES: | ||||||||
| Accrued severance pay | 1,155 | 1,051 | ||||||
| Operating lease liabilities | 14,727 | 15,065 | ||||||
| Other long-term liabilities | 62 | 138 | ||||||
| Total long-term liabilities | 15,944 | 16,254 | ||||||
| SHAREHOLDERS' EQUITY | 712,573 | 726,899 | ||||||
| Total liabilities and shareholders' equity | $ | 770,510 | $ | 787,484 | ||||
5
KORNIT DIGITAL LTD.
AND ITS SUBSIDIARIES
CONSOLIDATED STATEMENTS OF OPERATIONS
(U.S. dollars in thousands, except share and per share data)
| Three
Months Ended December 31, | Year Ended December 31, | |||||||||||||||
| 2025 | 2024 | 2025 | 2024 | |||||||||||||
| (Unaudited) | (Unaudited) | (Audited) | ||||||||||||||
| Revenues | ||||||||||||||||
| Products | $ | 45,674 | $ | 47,711 | $ | 156,086 | $ | 148,086 | ||||||||
| Services | 13,181 | 12,985 | 52,114 | 55,739 | ||||||||||||
| Total revenues | 58,855 | 60,696 | 208,200 | 203,825 | ||||||||||||
| Cost of revenues | ||||||||||||||||
| Products | 17,733 | 18,088 | 67,468 | 61,697 | ||||||||||||
| Services | 12,489 | 11,479 | 48,466 | 50,366 | ||||||||||||
| Total cost of revenues | 30,222 | 29,567 | 115,934 | 112,063 | ||||||||||||
| Gross profit | 28,633 | 31,129 | 92,266 | 91,762 | ||||||||||||
| Operating expenses: | ||||||||||||||||
| Research and development, net | 10,297 | 9,781 | 37,731 | 41,578 | ||||||||||||
| Sales and marketing | 14,559 | 15,200 | 58,722 | 58,413 | ||||||||||||
| General and administrative | 7,360 | 7,358 | 30,385 | 29,086 | ||||||||||||
| Total operating expenses | 32,216 | 32,339 | 126,838 | 129,077 | ||||||||||||
| Operating loss | (3,583 | ) | (1,210 | ) | (34,572 | ) | (37,315 | ) | ||||||||
| Financial income, net | 5,531 | 3,849 | 21,919 | 22,350 | ||||||||||||
| Income (loss) before taxes on income | 1,948 | 2,639 | (12,653 | ) | (14,965 | ) | ||||||||||
| Taxes on income | 297 | 423 | 865 | 1,835 | ||||||||||||
| Net income (loss) | $ | 1,651 | $ | 2,216 | $ | (13,518 | ) | $ | (16,800 | ) | ||||||
| Basic income (loss) per share | $ | 0.04 | $ | 0.05 | $ | (0.30 | ) | $ | (0.35 | ) | ||||||
| Weighted average number of shares used in computing basic net income (loss) per share | 45,103,991 | 47,180,390 | 45,244,517 | 47,482,820 | ||||||||||||
| Diluted income (loss) per share | $ | 0.03 | $ | 0.05 | $ | (0.30 | ) | $ | (0.35 | ) | ||||||
| Weighted average number of shares used in computing diluted net income (loss) per share | 47,439,631 | 48,222,449 | 45,244,517 | 47,482,820 | ||||||||||||
6
KORNIT DIGITAL LTD.
AND ITS SUBSIDIARIES
RECONCILIATION OF GAAP TO NON-GAAP CONSOLIDATED STATEMENTS OF OPERATIONS
(U.S. dollars in thousands, except share and per share data)
| Three
Months Ended December 31, | Year
Ended December 31, | |||||||||||||||
| 2025 | 2024 | 2025 | 2024 | |||||||||||||
| (Unaudited) | (Unaudited) | |||||||||||||||
| Revenues | $ | 58,855 | $ | 60,696 | $ | 208,200 | $ | 203,825 | ||||||||
| GAAP cost of revenues | $ | 30,222 | $ | 29,567 | $ | 115,934 | $ | 112,063 | ||||||||
| Cost of product recorded for share-based compensation (1) | (508 | ) | (524 | ) | (2,095 | ) | (2,018 | ) | ||||||||
| Cost of service recorded for share-based compensation (1) | (363 | ) | (409 | ) | (1,556 | ) | (1,703 | ) | ||||||||
| Intangible assets amortization on cost of product (2) | (151 | ) | (176 | ) | (601 | ) | (936 | ) | ||||||||
| Intangible assets amortization on cost of service (2) | (161 | ) | (160 | ) | (640 | ) | (640 | ) | ||||||||
| Restructuring expenses (3) | - | (1,067 | ) | (1,055 | ) | (1,981 | ) | |||||||||
| Non-GAAP cost of revenues | $ | 29,039 | $ | 27,231 | $ | 109,987 | $ | 104,785 | ||||||||
| GAAP gross profit | $ | 28,633 | $ | 31,129 | $ | 92,266 | $ | 91,762 | ||||||||
| Gross profit adjustments | 1,183 | 2,336 | 5,947 | 7,278 | ||||||||||||
| Non-GAAP gross profit | $ | 29,816 | $ | 33,465 | $ | 98,213 | $ | 99,040 | ||||||||
| GAAP operating expenses | $ | 32,216 | $ | 32,339 | $ | 126,838 | $ | 129,077 | ||||||||
| Share-based compensation (1) | (4,372 | ) | (4,151 | ) | (18,292 | ) | (18,035 | ) | ||||||||
| Intangible assets amortization (2) | (74 | ) | (88 | ) | (297 | ) | (350 | ) | ||||||||
| Restructuring expenses (3) | (633 | ) | (105 | ) | (1,180 | ) | (862 | ) | ||||||||
| Non-GAAP operating expenses | $ | 27,137 | $ | 27,995 | $ | 107,069 | $ | 109,830 | ||||||||
| GAAP Financial income, net | $ | 5,531 | $ | 3,849 | $ | 21,919 | $ | 22,350 | ||||||||
| Foreign exchange income (losses) associated with ASC 842 | 419 | (169 | ) | 2,155 | 388 | |||||||||||
| Non-GAAP Financial income, net | $ | 5,950 | $ | 3,680 | $ | 24,074 | $ | 22,738 | ||||||||
| GAAP Taxes on income | $ | 297 | $ | 423 | $ | 865 | $ | 1,835 | ||||||||
| Non-GAAP Taxes on income | $ | 297 | $ | 423 | $ | 865 | $ | 1,835 | ||||||||
| GAAP Net income (loss) | $ | 1,651 | $ | 2,216 | $ | (13,518 | ) | $ | (16,800 | ) | ||||||
| Share-based compensation (1) | 5,243 | 5,084 | 21,943 | 21,756 | ||||||||||||
| Intangible assets amortization (2) | 386 | 424 | 1,538 | 1,926 | ||||||||||||
| Restructuring expenses (3) | 633 | 1,172 | 2,235 | 2,843 | ||||||||||||
| Foreign exchange income (losses) associated with ASC 842 | 419 | (169 | ) | 2,155 | 388 | |||||||||||
| Non-GAAP net income | $ | 8,332 | $ | 8,727 | $ | 14,353 | $ | 10,113 | ||||||||
| GAAP diluted income (loss) per share | $ | 0.03 | $ | 0.05 | $ | (0.30 | ) | $ | (0.35 | ) | ||||||
| Non-GAAP diluted income per share | $ | 0.18 | $ | 0.18 | $ | 0.31 | $ | 0.20 | ||||||||
| Weighted average number of shares | ||||||||||||||||
| Shares used in computing GAAP diluted net income (loss) per share | 47,439,631 | 48,222,449 | 45,244,517 | 47,482,820 | ||||||||||||
| Shares used in computing Non-GAAP diluted net income per share | 47,439,631 | 49,868,143 | 46,136,365 | 49,341,794 | ||||||||||||
| (1) Share-based compensation | ||||||||||||||||
| Cost of product revenues | $ | 508 | $ | 524 | $ | 2,095 | $ | 2,018 | ||||||||
| Cost of service revenues | 363 | 409 | 1,556 | 1,703 | ||||||||||||
| Research and development | 1,168 | 1,255 | 4,777 | 5,310 | ||||||||||||
| Sales and marketing | 1,585 | 1,212 | 6,683 | 6,228 | ||||||||||||
| General and administrative | 1,619 | 1,684 | 6,832 | 6,497 | ||||||||||||
| $ | 5,243 | $ | 5,084 | $ | 21,943 | $ | 21,756 | |||||||||
| (2) Intangible assets amortization | ||||||||||||||||
| Cost of product revenues | $ | 151 | $ | 176 | $ | 601 | $ | 936 | ||||||||
| Cost of service revenues | 161 | 160 | 640 | 640 | ||||||||||||
| Sales and marketing | 74 | 88 | 297 | 350 | ||||||||||||
| $ | 386 | $ | 424 | $ | 1,538 | $ | 1,926 | |||||||||
| (3) Restructuring expenses | ||||||||||||||||
| Cost of product revenues | $ | - | $ | 818 | $ | 1,037 | $ | 1,683 | ||||||||
| Cost of service revenues | - | 249 | 18 | 298 | ||||||||||||
| Research and development | - | - | 44 | 235 | ||||||||||||
| Sales and marketing | 276 | - | 650 | 190 | ||||||||||||
| General and administrative | 357 | 105 | 486 | 437 | ||||||||||||
| $ | 633 | $ | 1,172 | $ | 2,235 | $ | 2,843 | |||||||||
7
KORNIT
DIGITAL LTD.
AND ITS SUBSIDIARIES
CONSOLIDATED STATEMENTS OF CASH FLOWS
(U.S. dollars in thousands)
| Three
Months Ended December 31, | Year
Ended December 31, | |||||||||||||||
| 2025 | 2024 | 2025 | 2024 | |||||||||||||
| (Unaudited) | (Unaudited) | (Audited) | ||||||||||||||
| Cash flows from operating activities: | ||||||||||||||||
| Net income (loss) | $ | 1,651 | $ | 2,216 | $ | (13,518 | ) | $ | (16,800 | ) | ||||||
| Adjustments to reconcile net income (loss) to net cash provided by operating activities: | ||||||||||||||||
| Depreciation and amortization | 3,190 | 3,313 | 11,897 | 13,047 | ||||||||||||
| Restructuring and other charges | 856 | 1,172 | 856 | 1,172 | ||||||||||||
| Fair value of warrants deducted from revenues | - | - | - | 3,273 | ||||||||||||
| Share-based compensation | 5,243 | 5,084 | 21,943 | 21,756 | ||||||||||||
| Amortization of premium and accretion of discount on marketable securities, net | (179 | ) | (230 | ) | (953 | ) | (389 | ) | ||||||||
| Realized loss on sale and redemption of marketable securities | - | (45 | ) | (58 | ) | (164 | ) | |||||||||
| Loss from disposal of property and Equipments | 117 | - | 273 | - | ||||||||||||
| Change in operating assets and liabilities: | ||||||||||||||||
| Trade receivables, net | 3,932 | 8,673 | 4,663 | 28,173 | ||||||||||||
| Other accounts receivables and prepaid expenses | 1,339 | 1,795 | (4,540 | ) | 2,832 | |||||||||||
| Inventory | 1,402 | 2,875 | 9,677 | 3,005 | ||||||||||||
| Operating leases right-of-use assets and liabilities, net | 456 | (266 | ) | 2,117 | (502 | ) | ||||||||||
| Deposits and other long term assets | (1,744 | ) | (674 | ) | (5,476 | ) | (2,333 | ) | ||||||||
| Trade payables | 165 | 3,856 | (3,787 | ) | 2,150 | |||||||||||
| Employees and payroll accruals | 992 | 1,020 | 1,980 | 2,456 | ||||||||||||
| Deferred revenues and advances from customers | (203 | ) | 798 | (810 | ) | 181 | ||||||||||
| Other payables and accrued expenses | (6,348 | ) | (2,950 | ) | 236 | (9,020 | ) | |||||||||
| Accrued severance pay, net | (232 | ) | 6 | 25 | (52 | ) | ||||||||||
| Other long - term liabilities | (30 | ) | 20 | (76 | ) | (60 | ) | |||||||||
| Net cash provided by operating activities | 10,607 | 26,663 | 24,449 | 48,725 | ||||||||||||
| Cash flows from investing activities: | ||||||||||||||||
| Purchase of property, plant and equipment and capitalized software development costs | (8,138 | ) | (1,920 | ) | (21,274 | ) | (15,140 | ) | ||||||||
| Proceeds from (investment in) short-term bank deposits, net | (30,643 | ) | (36,533 | ) | (162,512 | ) | 29,666 | |||||||||
| Proceeds from sales and redemption of marketable securities | 11,765 | 12,500 | 24,825 | 22,994 | ||||||||||||
| Proceeds from maturities of marketable securities | 14,920 | 12,012 | 222,320 | 56,641 | ||||||||||||
| Investment in marketable securities | - | (16,772 | ) | (60,226 | ) | (62,673 | ) | |||||||||
| Net cash provided by (used in) investing activities | (12,096 | ) | (30,713 | ) | 3,133 | 31,488 | ||||||||||
| Cash flows from financing activities: | ||||||||||||||||
| Exercise of employee stock options | - | 594 | 808 | 716 | ||||||||||||
| Payments related to shares withheld for taxes | (240 | ) | (402 | ) | (1,867 | ) | (1,476 | ) | ||||||||
| Repurchase of ordinary shares | (1,050 | ) | (75,000 | ) | (26,050 | ) | (84,055 | ) | ||||||||
| Net cash used in financing activities | (1,290 | ) | (74,808 | ) | (27,109 | ) | (84,815 | ) | ||||||||
| Increase (decrease) in cash and cash equivalents | (2,779 | ) | (78,858 | ) | 473 | (4,602 | ) | |||||||||
| Cash and cash equivalents at the beginning of the period | 38,255 | 113,861 | 35,003 | 39,605 | ||||||||||||
| Cash and cash equivalents at the end of the period | $ | 35,476 | $ | 35,003 | $ | 35,476 | $ | 35,003 | ||||||||
| Non-cash investing and financing activities: | ||||||||||||||||
| Purchase of property and equipment on credit | 1,074 | 247 | 1,074 | 247 | ||||||||||||
| Inventory transferred to be used as property and equipment | 445 | 3,156 | 3,744 | 4,732 | ||||||||||||
| Property, plant and equipment transferred to be used as inventory | 56 | 47 | 290 | 367 | ||||||||||||
| Lease liabilities arising from obtaining right-of-use assets | 372 | 623 | 1,630 | (448 | ) | |||||||||||
8
KORNIT DIGITAL LTD.
AND ITS SUBSIDIARIES
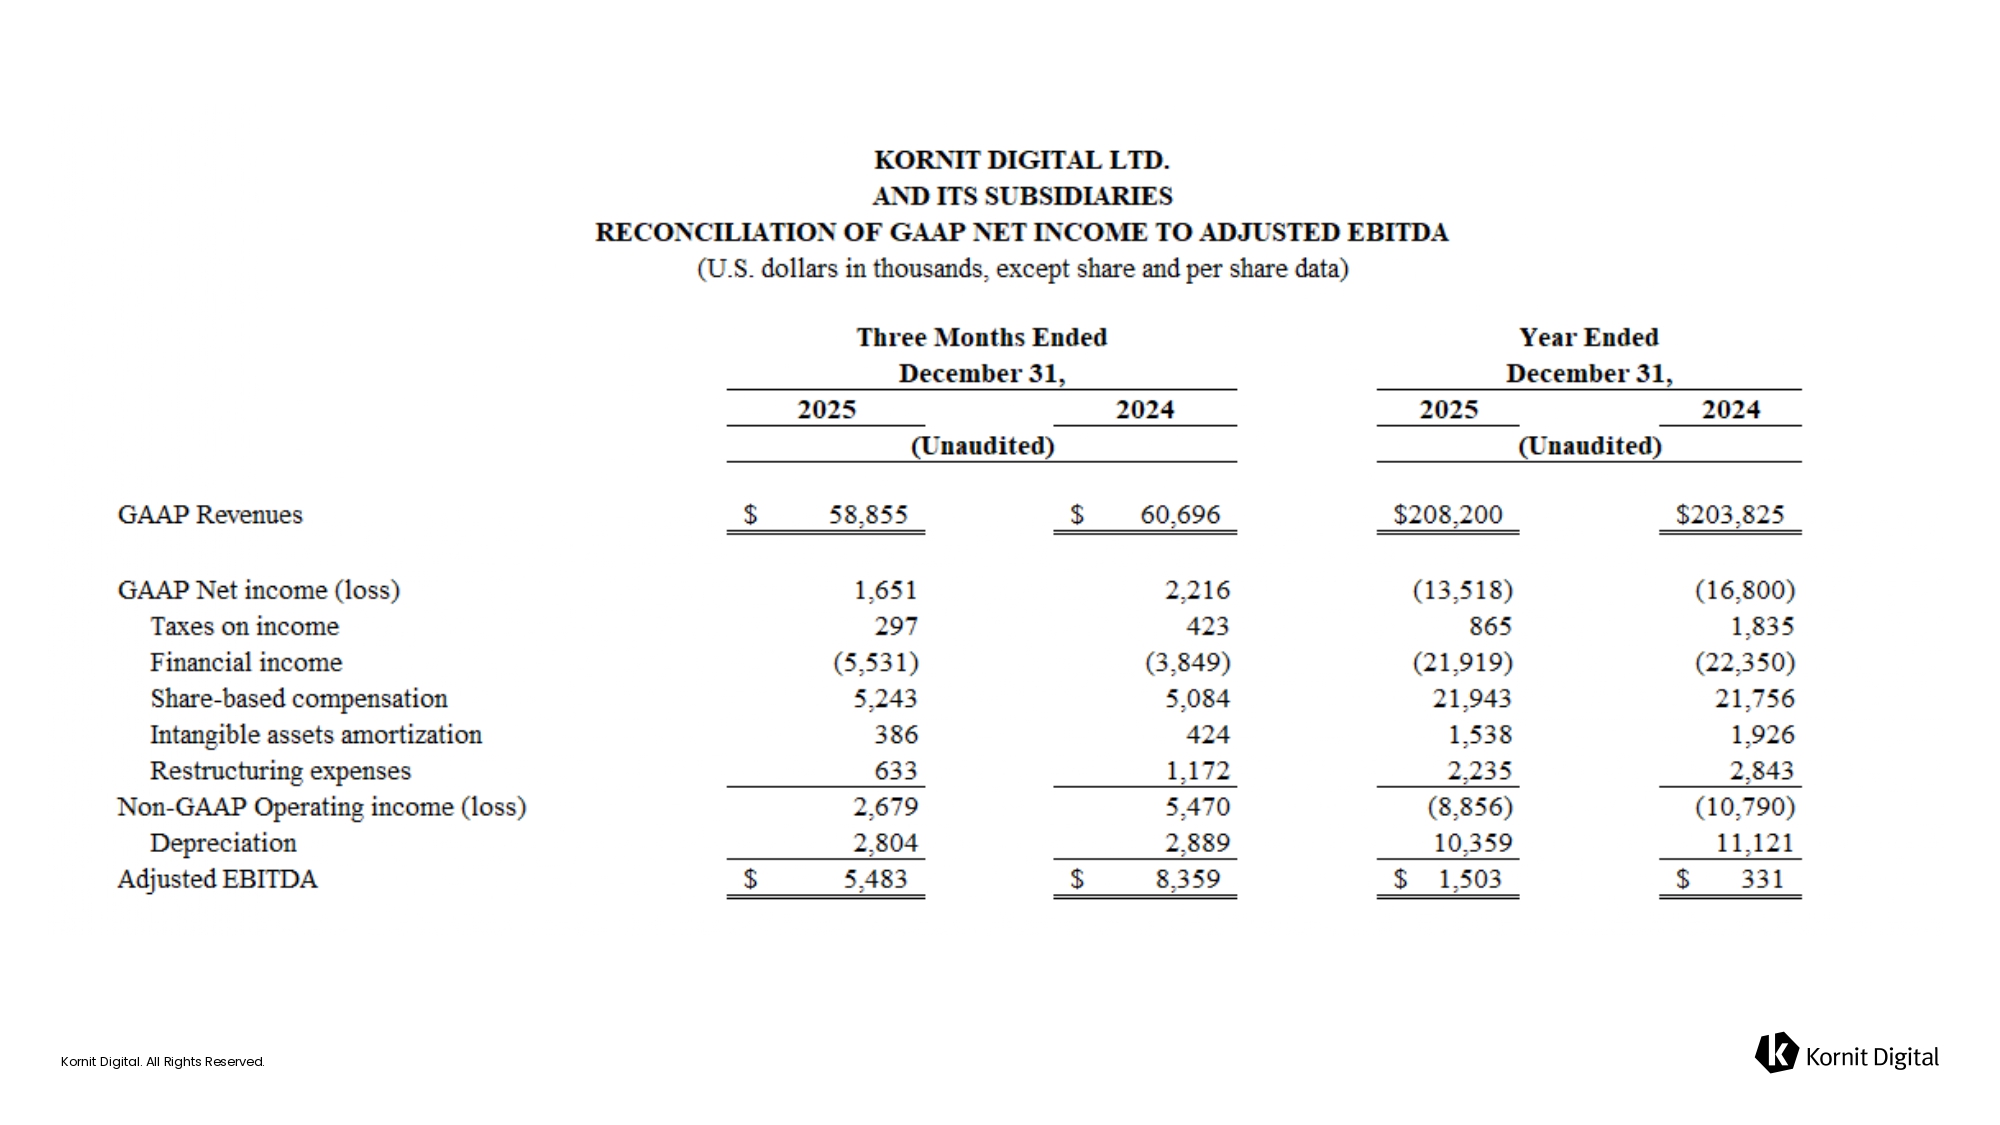
RECONCILIATION OF GAAP NET INCOME TO ADJUSTED EBITDA
(U.S. dollars in thousands, except share and per share data)
| Three
Months Ended December 31, | Year
Ended December 31, | |||||||||||||||
| 2025 | 2024 | 2025 | 2024 | |||||||||||||
| (Unaudited) | (Unaudited) | |||||||||||||||
| GAAP Revenues | $ | 58,855 | $ | 60,696 | $ | 208,200 | $ | 203,825 | ||||||||
| GAAP Net income (loss) | 1,651 | 2,216 | (13,518 | ) | (16,800 | ) | ||||||||||
| Taxes on income | 297 | 423 | 865 | 1,835 | ||||||||||||
| Financial income | (5,531 | ) | (3,849 | ) | (21,919 | ) | (22,350 | ) | ||||||||
| Share-based compensation | 5,243 | 5,084 | 21,943 | 21,756 | ||||||||||||
| Intangible assets amortization | 386 | 424 | 1,538 | 1,926 | ||||||||||||
| Restructuring expenses | 633 | 1,172 | 2,235 | 2,843 | ||||||||||||
| Non-GAAP Operating income (loss) | 2,679 | 5,470 | (8,856 | ) | (10,790 | ) | ||||||||||
| Depreciation | 2,804 | 2,889 | 10,359 | 11,121 | ||||||||||||
| Adjusted EBITDA | $ | 5,483 | $ | 8,359 | $ | 1,503 | $ | 331 | ||||||||
9
Exhibit 99.2
Kornit Digital. All Rights Reserved. Kornit Digital. All Rights Reserved. Kornit Digital (NASDAQ: KRNT) Fourth Quarter and Full - Year 2025 Earnings Conference Call Supporting Slides February 11, 2026 Kornit Digital. All Rights Reserved.
Kornit Digital. All Rights Reserved. On Today’s Call Ronen Samuel CEO Assaf Zipori CFO Andy Backman Chief Capital Markets Officer
Kornit Digital. All Rights Reserved. Safe Harbor This presentation contains “forward - looking statements” within the meaning of the Private Securities Litigation Reform Act of 1995 and other U . S . securities laws . Forward - looking statements are characterized by the use of forward - looking terminology such as “will,” “expects,” “anticipates,” “believes,” “intends,” “planned,” or other similar words . These forward - looking statements include, but are not limited to, statements relating to the Company’s objectives, plans and strategies, including with respect to the Company’s goals for 2026 and beyond, innovation roadmap, pipeline of opportunities and expected revenue growth, and all additional statements that address developments that the Company expects or anticipates will or may occur in the future . Forward - looking statements are not guarantees of future performance and are subject to risks and uncertainties . The Company has based these forward - looking statements on assumptions and assessments made by its management in light of their experience and their perception of historical trends, current conditions, expected future developments and other factors they believe to be appropriate . Important factors that could cause actual results, developments and business decisions to differ materially from those anticipated in these forward - looking statements include, among other things : the Company’s degree of success in developing, introducing and selling new or improved products and product enhancements including specifically the Company’s Poly Pro and Presto products, and the Company’s Apollo direct - to - garment platform ; the extent of the Company’s ability to increase sales of its systems, ink and consumables ; the extent of the Company’s ability to continue to grow customer adoption of the AIC model ; the development of the market for digital textile printing ; the Company’s securities class action litigation expenses ; and those additional factors referred to under “Risk Factors” in Item 3 . D of the Company’s Annual Report on Form 20 - F for the year ended December 31 , 2024 , filed with the SEC on March 28 , 2025 . Any forward - looking statements in this presentation are made as of the date hereof, and will not be updated by the Company, whether as a result of new information, future events or otherwise, except as required by law . In addition to U . S . GAAP financials, this presentation includes certain non - GAAP financial measures . These non - GAAP financial measures are in addition to, and not a substitute for or superior to, measures of financial performance prepared in accordance with U . S . GAAP . Please see the reconciliation table that appears among the financial tables in our earnings release being issued today, which earnings release is attached as Exhibit 99 . 1 to our report of foreign private issuer on Form 6 - K being furnished to the SEC today, which reconciliation table is incorporated by reference in this presentation . Please also see Slide 21 of this presentation . This presentation contains statistical data that we obtained from industry publications and reports generated by third parties . Although we believe that the publications and reports are reliable, we have not independently verified this statistical data . Kornit, Kornit Digital, the K logo, and NeoPigment are trademarks of Kornit Digital Ltd . All other trademarks are the property of their respective owners and are used for reference purposes only . Such use should not be construed as an endorsement of our products or services .

Kornit Digital. All Rights Reserved. Business Highlights
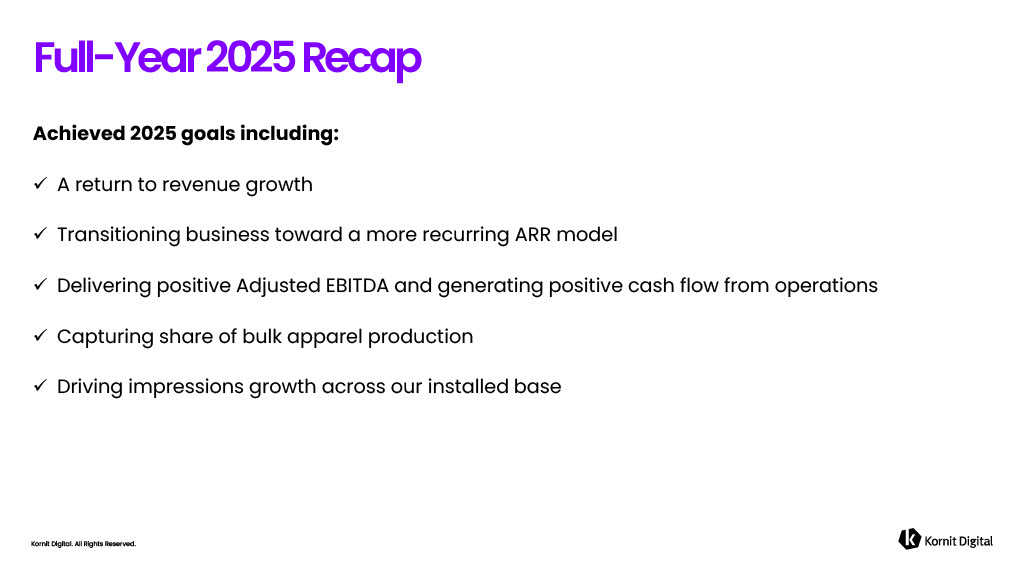
Kornit Digital. All Rights Reserved. Full - Year 2025 Recap Achieved 2025 goals including: x A return to revenue growth x Transitioning business toward a more recurring ARR model x Delivering positive Adjusted EBITDA and generating positive cash flow from operations x Capturing share of bulk apparel production x Driving impressions growth across our installed base
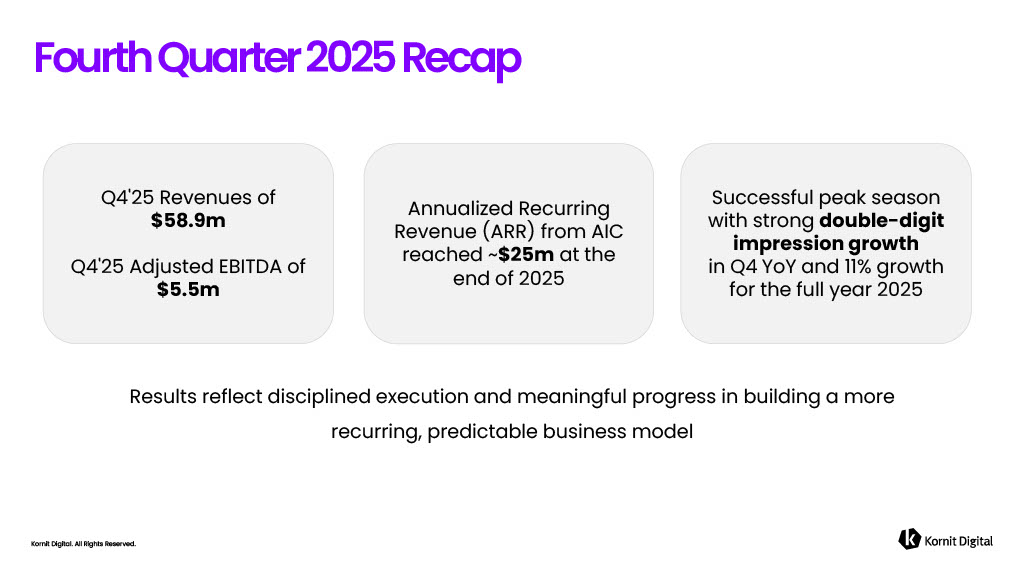
Kornit Digital. All Rights Reserved. Results reflect disciplined execution and meaningful progress in building a more recurring, predictable business model Fourth Quarter 2025 Recap Q4'25 Revenues of $58.9m Q4'25 Adjusted EBITDA of $5.5m Annualized Recurring Revenue (ARR) from AIC reached ~ $25m at the end of 2025 Successful peak season with strong double - digit impression growth in Q4 YoY and 11% growth for the full year 2025
Kornit Digital. All Rights Reserved. • Seeing a shift of impressions into longer runs and incremental bulk apparel production moving to digital • Over 40 % of system deals in 2025 came from net new customers, many of them traditional screen printers adopting digital for the first time • Since the first Apollo installation, adoption continues to accelerate as customers expand their fleets and increase utilization Progress Updates
Kornit Digital. All Rights Reserved. Apollo & Atlas • Over 40% of existing Apollo customers added a second system or more in 2025 • Atlas MAX family continues to gain traction among small and mid - size screen printers Progress Updates Bulk Apparel • Impressions are shifting into longer runs, with incremental bulk apparel production moving to digital • Over 40% of systems deals in 2025 were from net new customers, many traditional screen printers adopting digital production for the first time Customized Design • Seeing encouraging momentum in our customized design segment • Growth momentum returning across several of our key accounts
Kornit Digital. All Rights Reserved. • Continue to see growth in impressions and pipeline development in the sports footwear market • Global strategic customer recently placed an order to continue upgrading its fleet to the Atlas MAX platform, reinforcing long - term confidence in our technology and partnership Progress Updates
Kornit Digital. All Rights Reserved. Looking Ahead in 2026 • Priorities remain clear : • Continue driving incremental impressions from screen market • Expanding AIC program • Delivering on our innovation roadmap to support growth beyond 2026 • Entering 2026 with a growing pipeline of opportunities and much better visibility for the year • Today, more than 83 % of our revenues are recurring or highly predictable • Expecting low single - digit revenue growth in 2026 , reflecting our deliberate decision to accelerate transition to AIC model, alongside stronger profitability expansion and continued positive cash from operations
Kornit Digital. All Rights Reserved. KONNECTIONS '26 DEFINING THE FUTURE OF DIGITAL PRINT. TOGETHER Showcasing breakthrough innovations aimed at expanding addressable markets, accelerating digital adoption, and enabling future growth HOLLYWOOD, FL | THE DIPLOMAT BEACH RESORT APRIL 12 – 14 , 2026

Kornit Digital. All Rights Reserved. Financial Highlights
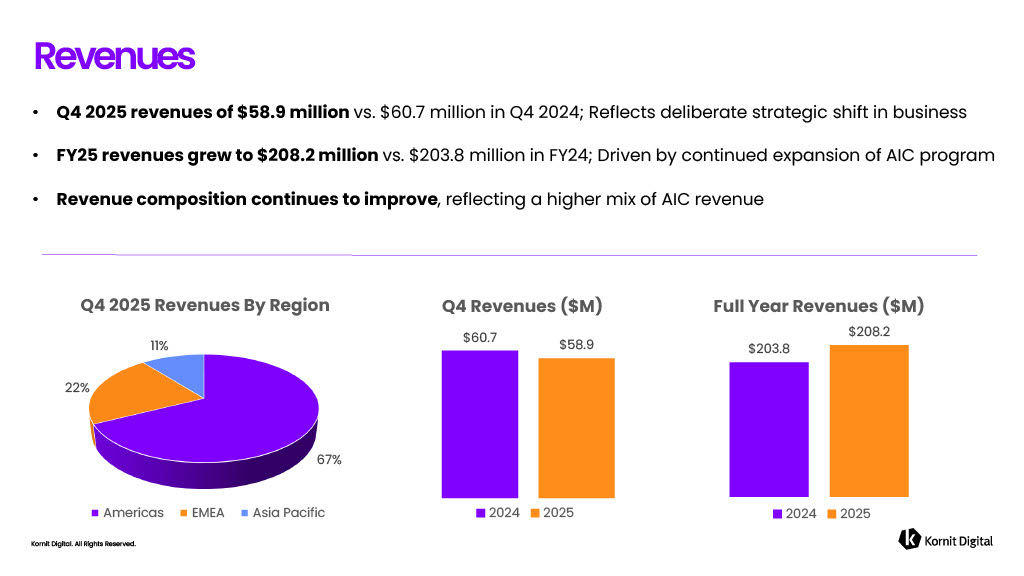
Kornit Digital. All Rights Reserved. • Q4 2025 revenues of $58.9 million vs. $60.7 million in Q4 2024; R eflects deliberate strategic shift in business • FY25 revenues grew to $208.2 million vs. $203.8 million in FY24; D riven by continued expansion of AIC program • Revenue composition continues to improve , reflecting a higher mix of AIC revenue Revenues $203.8 $208.2 Full Year Revenues ($M) 2024 2025 67% 22% 11% Q4 2025 Revenues By Region Americas EMEA Asia Pacific $ 60.7 $58.9 Q4 Revenues ($M) 2024 2025
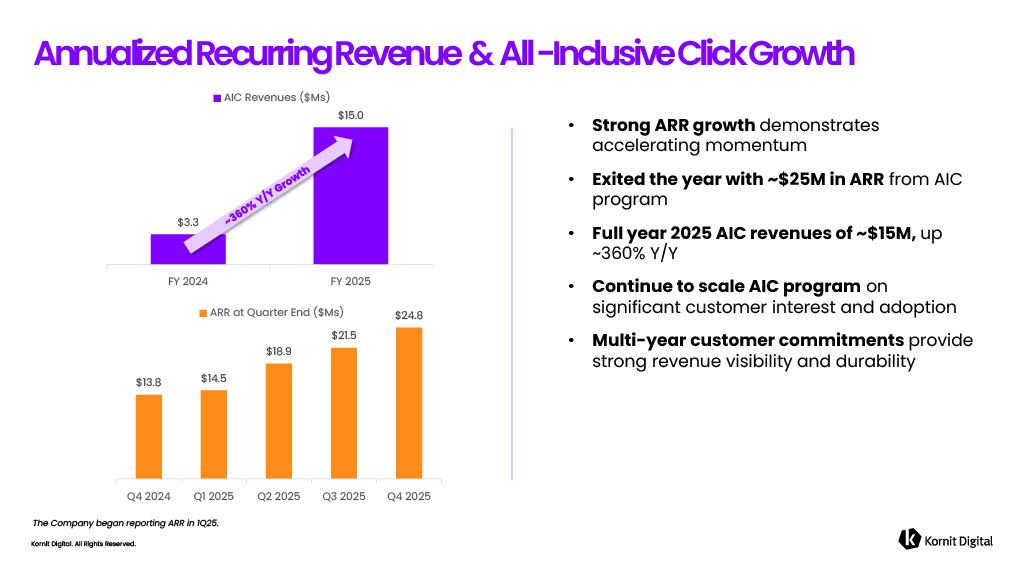
Kornit Digital. All Rights Reserved. • Strong ARR growth demonstrates accelerating momentum • Exited the year with ~$25M in ARR from AIC program • Full year 2025 AIC revenues of ~$15M, up ~360% Y/Y • Continue to scale AIC program on significant customer interest and adoption • Multi - year customer commitments provide strong revenue visibility and durability Annualized Recurring Revenue & All - Inclusive Click Growth The Company began reporting ARR in 1 Q 25 . $13.8 $14.5 $18.9 $21.5 $24.8 Q4 2024 Q1 2025 Q2 2025 Q3 2025 Q4 2025 ARR at Quarter End ($Ms) $3.3 $15.0 FY 2024 FY 2025 AIC Revenues ($Ms)
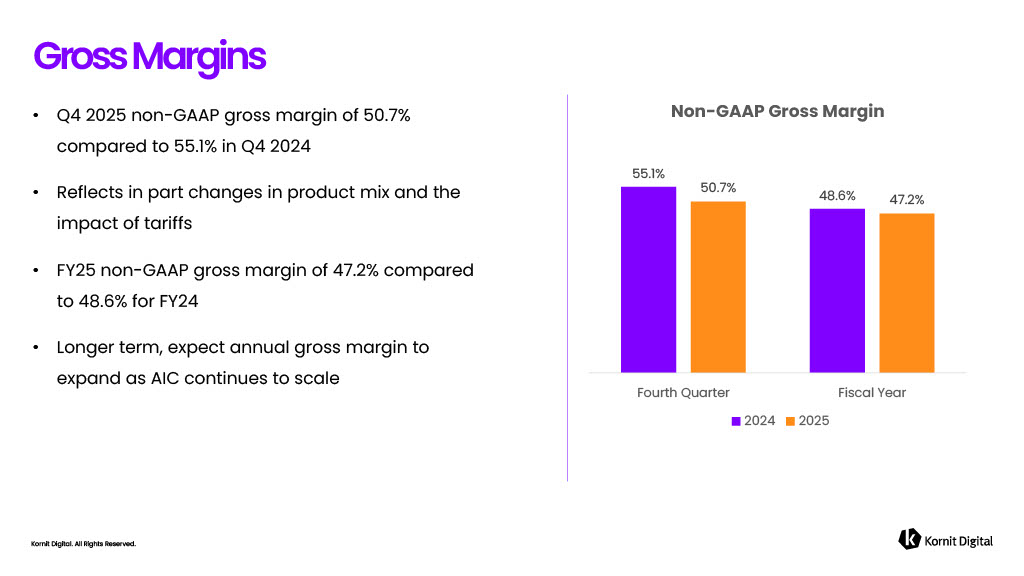
Kornit Digital. All Rights Reserved. • Q4 2025 non - GAAP gross margin of 50.7% compared to 55.1% in Q4 2024 • Reflects in part changes in product mix and the impact of tariffs • FY25 non - GAAP gross margin of 47.2% compared to 48.6% for FY24 • Longer term, expect annual gross margin to expand as AIC continues to scale Gross Margins 55.1% 48.6% 50.7% 47.2 % Fourth Quarter Fiscal Year Non - GAAP Gross Margin 2024 2025
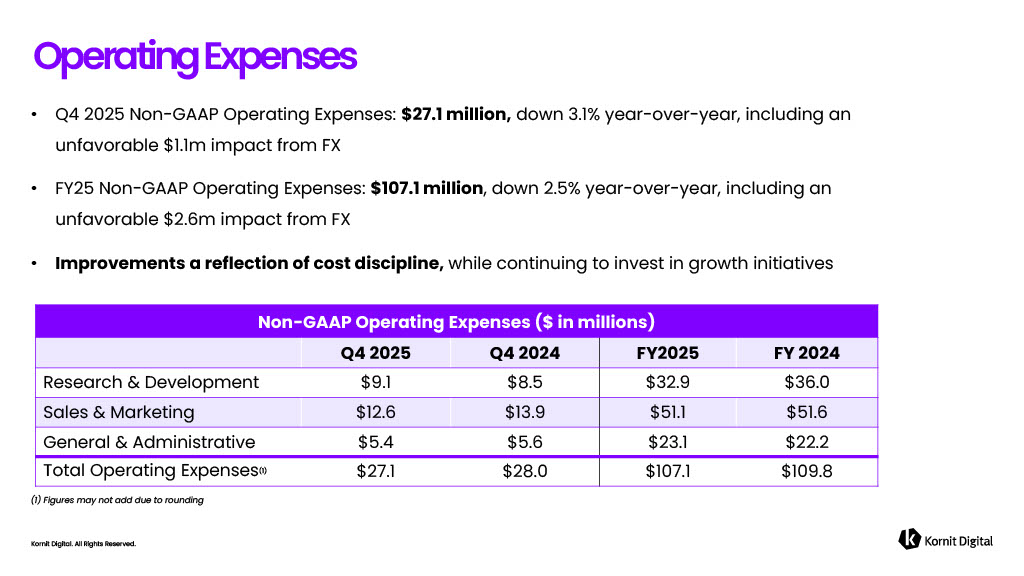
Kornit Digital. All Rights Reserved. • Q4 2025 Non - GAAP Operating Expenses: $27.1 million, down 3.1% year - over - year, including an unfavorable $1.1m impact from FX • FY25 Non - GAAP Operating Expenses: $107.1 million , down 2.5% year - over - year, including an unfavorable $2.6m impact from FX • Improvements a reflection of cost discipline, while continuing to invest in growth initiatives Operating Expenses (1) Figures may not add due to rounding Non - GAAP Operating Expenses ($ in millions) FY 2024 FY2025 Q4 2024 Q4 2025 $36.0 $32.9 $8.5 $9.1 Research & Development $51.6 $51.1 $13.9 $12.6 Sales & Marketing $22.2 $23.1 $5.6 $5.4 General & Administrative $109.8 $107.1 $28.0 $27.1 Total Operating Expenses (1)
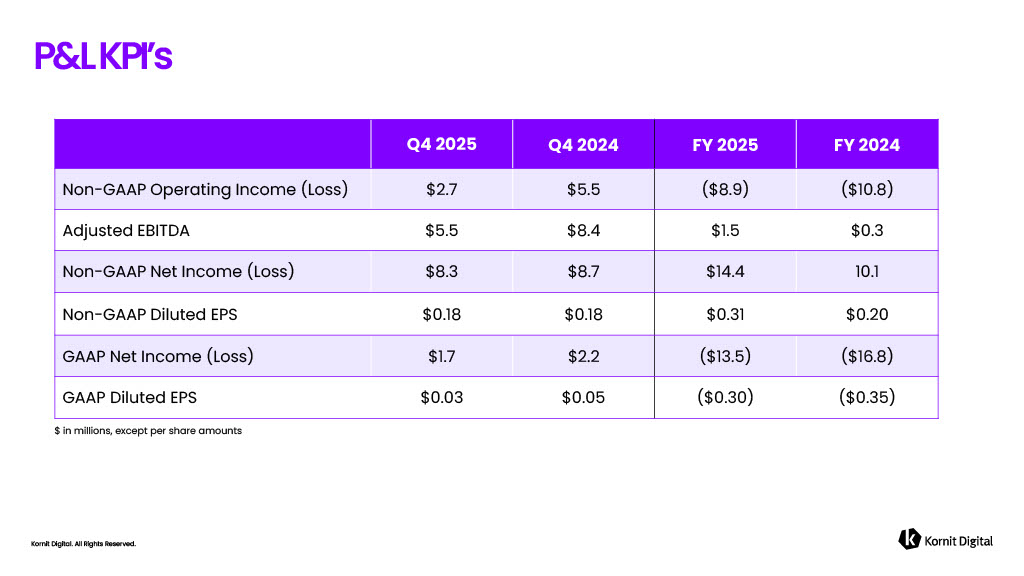
Kornit Digital. All Rights Reserved. P&L KPI’s $ in millions, except per share amounts FY 2024 FY 2025 Q4 2024 Q4 2025 ($10.8) ($8.9) $5.5 $2.7 Non - GAAP Operating Income (Loss) $0.3 $1.5 $8.4 $5.5 Adjusted EBITDA 10.1 $14.4 $8.7 $8.3 Non - GAAP Net Income (Loss) $0.20 $0.31 $0.18 $0.18 Non - GAAP Diluted EPS ($16.8) ($13.5) $2.2 $1.7 GAAP Net Income (Loss) ($0.35) ($0.30) $0.05 $0.03 GAAP Diluted EPS
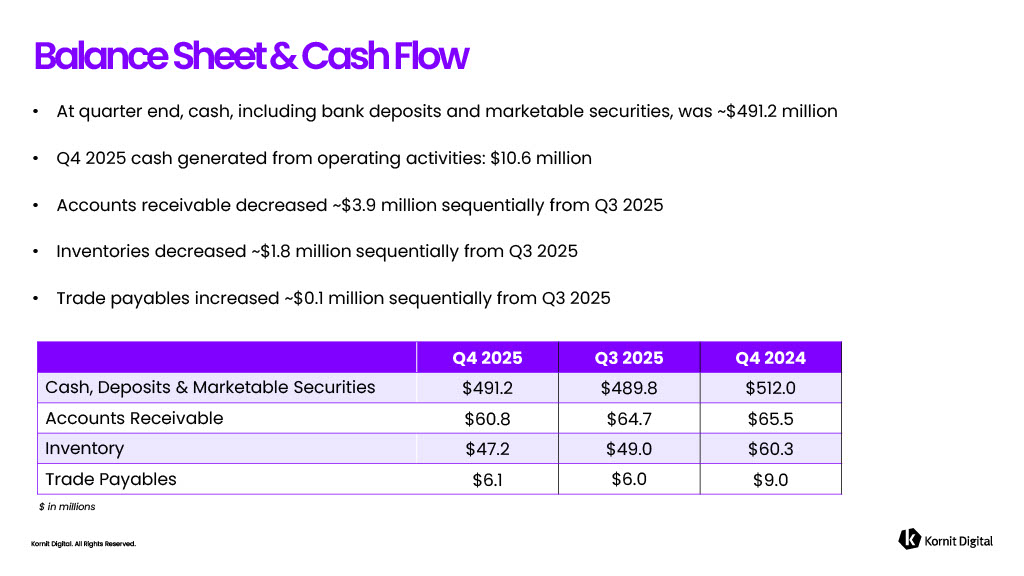
Kornit Digital. All Rights Reserved. • At quarter end, cash, including bank deposits and marketable securities, was ~$491.2 million • Q4 2025 cash generated from operating activities: $10.6 million • Accounts receivable decreased ~$3.9 million sequentially from Q3 2025 • Inventories decreased ~$1.8 million sequentially from Q3 2025 • Trade payables increased ~$0.1 million sequentially from Q3 2025 Balance Sheet & Cash Flow $ in millions Q4 2024 Q3 2025 Q4 2025 $512.0 $489.8 $491.2 Cash, Deposits & Marketable Securities $65.5 $64.7 $60.8 Accounts Receivable $60.3 $49.0 $47.2 Inventory $9 .0 $6.0 $6.1 Trade Payables
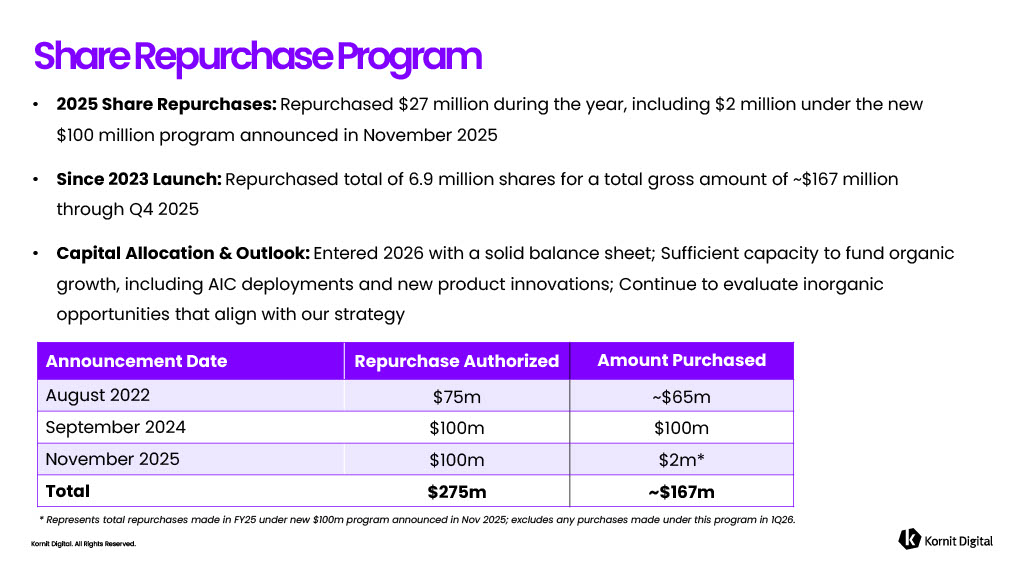
Kornit Digital. All Rights Reserved. • 2025 Share Repurchases: Repurchased $27 million during the year, including $2 million under the new $100 million program announced in November 2025 • Since 2023 Launch: Repurchased total of 6.9 million shares for a total gross amount of ~$167 million through Q4 2025 • Capital Allocation & Outlook: Entered 2026 with a solid balance sheet; Sufficient capacity to fund organic growth, including AIC deployments and new product innovations; Continue to evaluate inorganic opportunities that align with our strategy Share Repurchase Program * Represents total repurchases made in FY25 under new $100m program announced in Nov 2025; excludes any purchases made under thi s program in 1Q26. Amount Purchased Repurchase Authorized Announcement Date ~$65m $75m August 2022 $100m $100m September 2024 $2m* $100m November 2025 ~$167m $275m Total
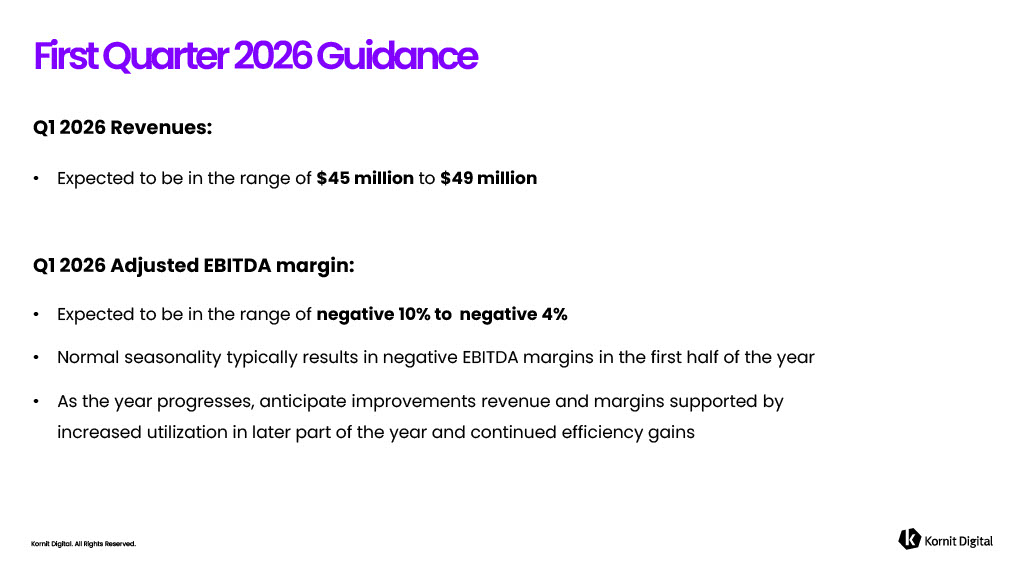
Kornit Digital. All Rights Reserved. Q1 2026 Revenues: • Expected to be in the range of $45 million to $49 million Q1 2026 Adjusted EBITDA margin: • Expected to be in the range of negative 10% to negative 4% • Normal seasonality typically results in negative EBITDA margins in the first half of the year • As the year progresses, anticipate improvements revenue and margins supported by increased utilization in later part of the year and continued efficiency gains First Quarter 2026 Guidance
Kornit Digital. All Rights Reserved.
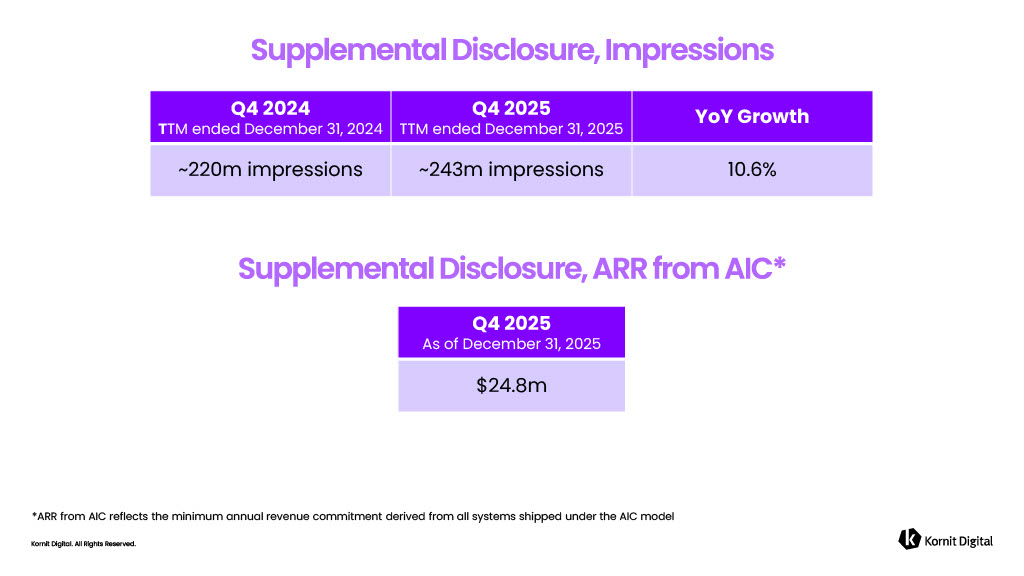
Kornit Digital. All Rights Reserved. YoY Growth Q4 2025 TTM ended December 31, 2025 Q4 2024 T TM ended December 31, 2024 10.6% ~243m impressions ~220m impressions Q4 2025 As of December 31, 2025 $24.8m *ARR from AIC reflects the minimum annual revenue commitment derived from all systems shipped under the AIC model

Kornit Digital. All Rights Reserved. Thank You!