
UNITED STATES
SECURITIES AND EXCHANGE COMMISSION
Washington, D.C. 20549
FORM 6-K
REPORT OF FOREIGN PRIVATE ISSUER
PURSUANT TO RULE 13a-16 OR 15d-16 OF
THE SECURITIES EXCHANGE ACT OF 1934
For the month of August 2026
Commission File Number 001-36903
KORNIT DIGITAL LTD.
(Translation of Registrant’s name into English)
12 Ha’Amal Street
Park Afek
Rosh Ha’Ayin 4824096 Israel
(Address of Principal Executive Office)
Indicate by check mark whether the registrant files or will file annual reports under cover of Form 20-F or Form 40-F.
Form 20-F ☒ Form 40-F ☐
CONTENTS
Results of Operations and Financial Condition- Quarter Ended June 30, 2026
On August 12, 2026, Kornit Digital Ltd. (“Kornit”) issued a press release entitled “Kornit Digital Reports Second Quarter 2026 Results,” in which Kornit reported its results of operations for the second quarter ended June 30, 2026. A copy of that press release is furnished as Exhibit 99.1 hereto.
Kornit is holding a conference call on August 12, 2026 to discuss its results for the second quarter ended June 30, 2026, and, in connection with that call, will make available to its investors a slide presentation to provide additional information regarding its business and its financial results. That slide presentation is attached as Exhibit 99.2 to this Report of Foreign Private Issuer on Form 6-K (this “Form 6-K”) and is incorporated herein by reference.
Exhibits
Incorporation by Reference
The U.S. GAAP financial information contained in the (i) consolidated balance sheets, (ii) consolidated statements of operations and (iii) consolidated statements of cash flows included in the press release attached as Exhibit 99.1 to this Form 6-K is hereby incorporated by reference into Kornit’s Registration Statements on Form S-8 (File No.’s 333-203970, 333-214015, 333-217039, 333-223794, 333-230567, 333-237346, 333-254749, 333-263975, 333-286158 and 333-294642).
1
SIGNATURES
Pursuant to the requirements of the Securities Exchange Act of 1934, the registrant has duly caused this report to be signed on its behalf by the undersigned, thereunto duly authorized.
| KORNIT DIGITAL LTD. | ||
| Date: August 12, 2026 | By: | /s/ Assaf Zippori |
| Name: | Assaf Zippori | |
| Title: | Chief Financial Officer | |
2
Exhibit 99.1

Kornit Digital Reports Second Quarter 2026 Results
Total Revenues of $55.3 Million, Above High End of Guidance as Business Transformation Continues
Positive Adjusted EBITDA Margin Above High End of Guidance
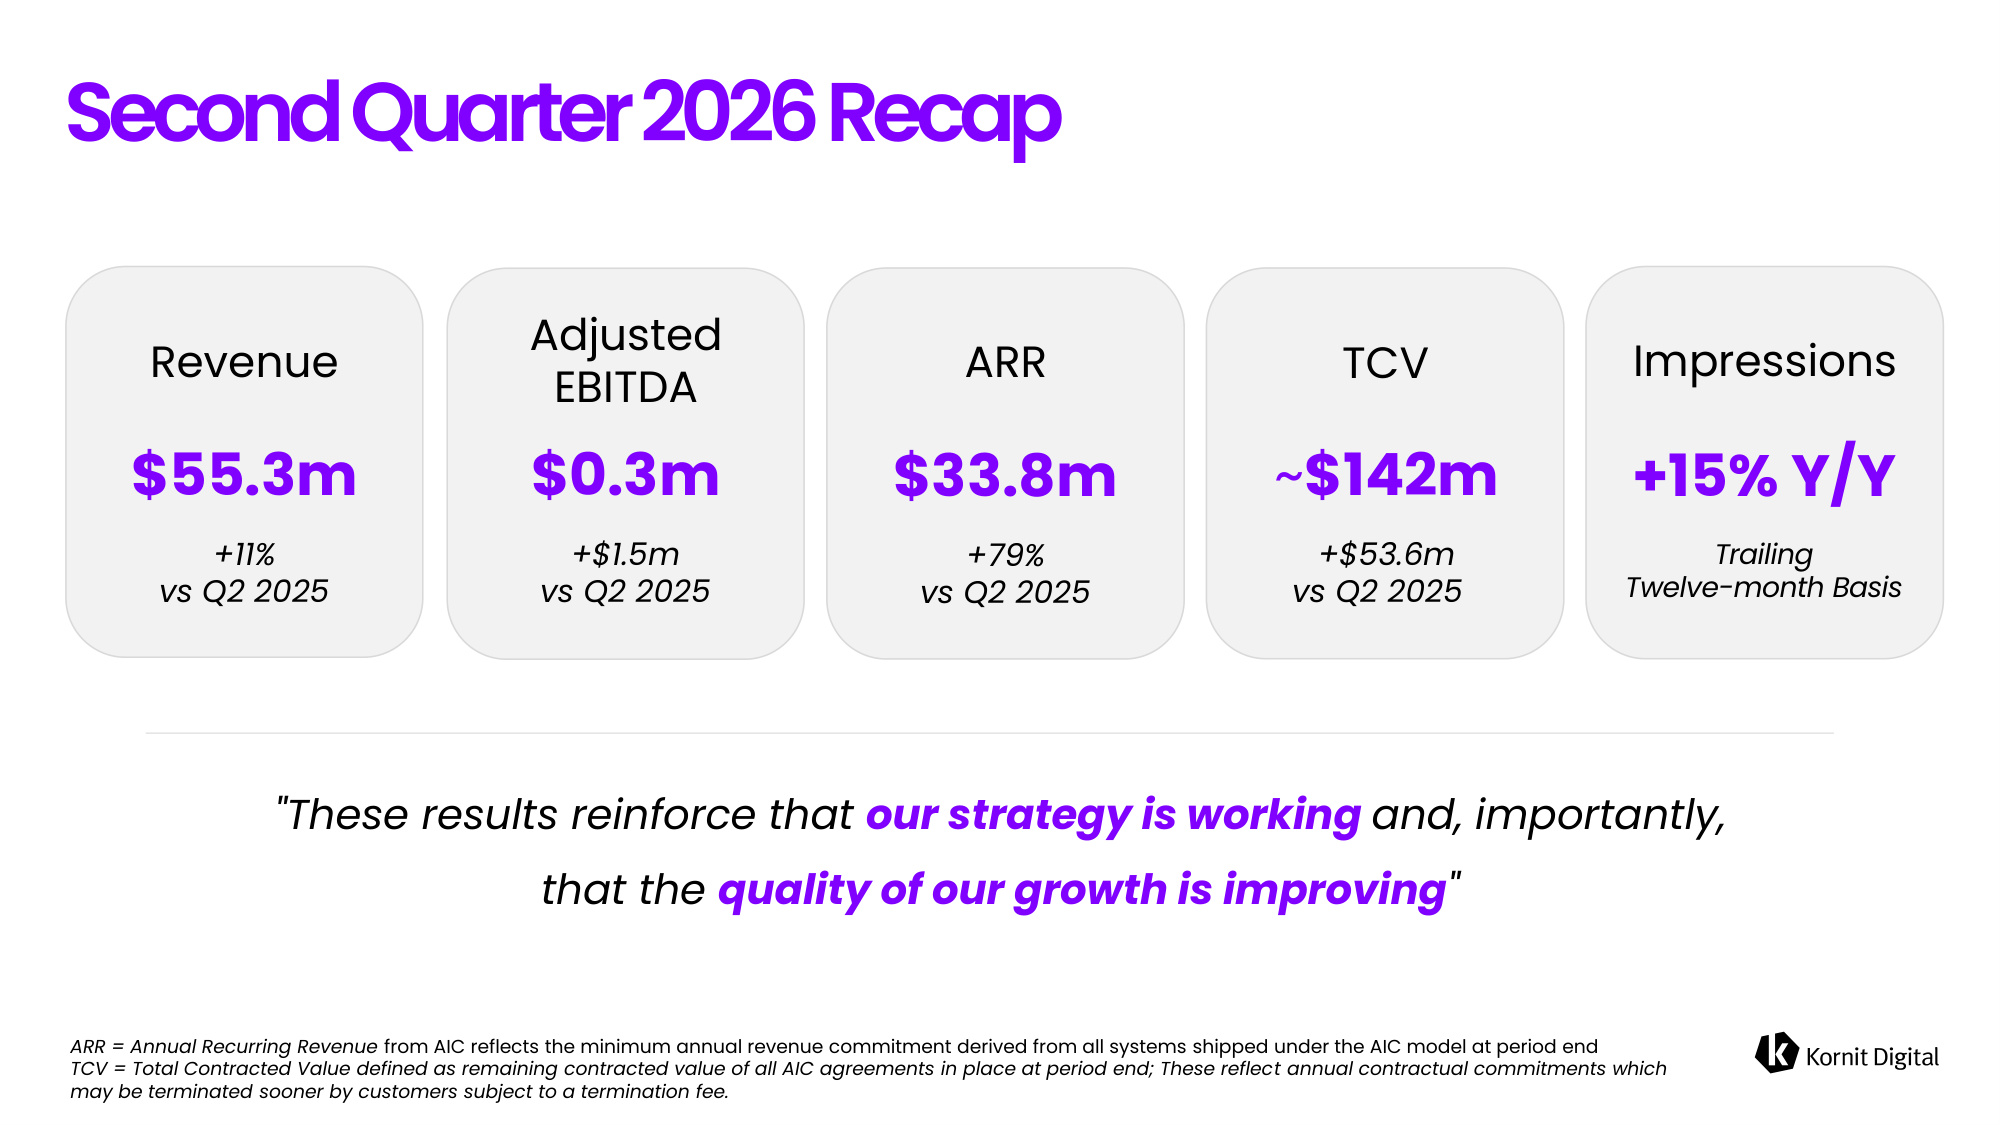
ARR Increased to $33.8 Million, Up 79% Year-Over-Year
AIC Revenues Increased 112% Year-Over-Year
Trailing Twelve-Month Impressions Up 15% Year-Over-Year
Strong Screen Market Penetration, Representing Approximately 60% of Systems Sold in the Second Quarter and First Half of 2026
Positive Operating Cash Flow for the Eleventh Consecutive Quarter
Rosh-Ha`Ayin, Israel – August 12, 2026 – Kornit Digital Ltd. (“Kornit”, “Kornit Digital” or the “Company”) (Nasdaq: KRNT), a global leader in sustainable, on-demand, digital fashion and textile production, today reported financial results for the second quarter ended June 30, 2026.
“The second quarter marked another important step in Kornit’s transformation,” said Ronen Samuel, Chief Executive Officer of Kornit Digital. “We are delivering growth while fundamentally improving the quality of our business. Strong Annual Recurring Revenue (“ARR”) and All-Inclusive Click (“AIC”) growth, increasing customer system utilization, as well as continued positive cash flow generation, all demonstrate the growing value of our offerings. With approximately 80% of our revenues being recurring or highly recurring in nature, we have greater visibility, and our business is becoming more resilient.”
“We are seeing clear momentum in the shift from analog to digital manufacturing, particularly among traditional screen printers. Approximately 60% of systems sold in both the second quarter and the first half of the year were to traditional screen printers, demonstrating the growing momentum behind the screen market’s transition from analog to digital production. With our industrial production systems, software, AI and automation, we believe Kornit is well positioned to capture this significant structural growth opportunity.”
“We enter the second half of the year with a healthy pipeline and continued momentum across both new customers and our existing installed base. Combined with market-leading technology and the accelerating shift to digital manufacturing, we believe Kornit is well positioned to create sustainable long-term value for our customers and shareholders.”
Second Quarter 2026 Results of Operations
| ● | Total revenues for the second quarter of 2026 increased to $55.3 million compared with $49.8 million in the prior year period. |
| ● | AIC revenues for the second quarter of 2026 increased by 112% compared with the prior year period. |
| ● | ARR at the end of the second quarter was approximately $33.8 million compared with $18.9 million at the end of the prior year period. |
| ● | GAAP gross profit margin for the second quarter of 2026 was 45.3% compared with 41.7% in the prior year period. On a non-GAAP basis, gross profit margin was 47.4%, compared with 46.3% in the prior year period. Both GAAP and non-GAAP gross profit margins were supported by a net tariff-related benefit of approximately $830,000, driven by a $2 million tariff refund during the quarter. |
| ● | GAAP operating expenses for the second quarter of 2026 were $39.9 million, compared with $31.6 million in the prior year period. On a non-GAAP basis, operating expenses were $28.8 million compared with $26.7 million in the prior year period. |
| ● | GAAP net loss for the second quarter of 2026 was $11.2 million, or ($0.26) per diluted share, compared with net loss of $7.5 million, or ($0.17) per diluted share, in the prior year period. |
| ● | Non-GAAP net income for the second quarter of 2026 was $1.7 million, or $0.04 per diluted share, compared with non-GAAP net income of $1.2 million, or $0.03 per diluted share, in the prior year period. |
| ● | Adjusted EBITDA for the second quarter of 2026 improved to $0.3 million compared with adjusted EBITDA loss of $1.2 million for the second quarter of 2025. Adjusted EBITDA margin for the second quarter of 2026 was 0.6% compared with negative 2.3% in the prior year period. |
Third Quarter 2026 Guidance
For the third quarter of 2026, the Company currently expects its revenues to be in the range of $55 million to $60 million and its adjusted EBITDA margin to be between breakeven and 3%.
Earnings Conference Call Information
The Company will host a conference call today, August 12, 2026, at 8:30 a.m. ET, or 3:30 p.m. Israel time, to discuss the results, followed by a question-and-answer session with the investor community.
2
A live webcast of the call can be accessed at ir.kornit.com. To access the call, participants may dial toll-free at 1-877-407-0792 or 1-201-689-8263. The toll-free Israeli number is 1 809 406 247.
To listen to a replay of the conference call, dial toll-free 1-844-512-2921 or 1-412-317-6671 and enter confirmation code 13760977. The telephone replay will be available approximately three hours after the completion of the live call until 11:59 pm ET on August 26, 2026. The call will also be available for replay via the webcast link on Kornit’s Investor Relations website.
About Kornit Digital
Kornit Digital (NASDAQ: KRNT) is a worldwide market leader in sustainable, on-demand, digital fashion and textile production technologies. The Company offers end-to-end solutions including digital printing systems, inks, consumables, software, and fulfillment services through its global fulfillment network. Headquartered in Israel with offices in the USA, Europe, and Asia Pacific, Kornit Digital serves customers in more than 100 countries. To learn more, visit www.kornit.com.
Forward Looking Statements
Certain statements in this press release are “forward-looking statements” within the meaning of the Private Securities Litigation Reform Act of 1995 and other U.S. securities laws. Forward-looking statements are characterized by the use of forward-looking terminology such as “will,” “expects,” “anticipates,” “believes,” “intends,” “planned,” or other similar words. These forward-looking statements include, but are not limited to, statements relating to the Company’s objectives, plans and strategies, including with respect to the Company’s AIC program, the Company’s prospective results of operations and financial condition, including the Company’s guidance for the third quarter of 2026; and all developments that the Company expects or anticipates will or may occur in the future. Forward-looking statements are not guarantees of future performance and are subject to risks and uncertainties. The Company has based these forward-looking statements on assumptions and assessments made by its management in light of their experience and their perception of historical trends, current conditions, expected future developments and other factors they believe to be appropriate. Important factors that could cause actual results, developments and business decisions to differ materially from those anticipated in these forward-looking statements include, among other things: the Company’s degree of success in developing, introducing and selling new or improved products and product enhancements including, specifically, the Company’s Presto products, the Company’s Atlas family of products and the Apollo direct-to-garment platform; the extent of the Company’s ability to increase sales of its systems, ink and consumables; the extent of the Company’s ability to continue to grow customer adoption of the AIC model; the development of the market for digital textile printing generally; the Company’s securities class action litigation expenses; and those additional factors referred to under “Risk Factors” in Item 3.D of the Company’s Annual Report on Form 20-F for the year ended December 31, 2025, filed with the SEC on March 26, 2026. Any forward-looking statements in this press release are made as of the date hereof, and will not be updated by the Company, whether as a result of new information, future events or otherwise, except as required by law.
3
Non-GAAP Discussion Disclosure
The Company presents certain non-GAAP financial measures in this press release and in the accompanying conference call to discuss the Company’s quarterly results. These non-GAAP financial measures reflect adjustments to corresponding GAAP financial measures in order to exclude the impact of the following: share-based compensation expenses; amortization of intangible assets; restructuring expenses; foreign exchange differences associated with ASC 842; and M&A and class action-related legal fees.
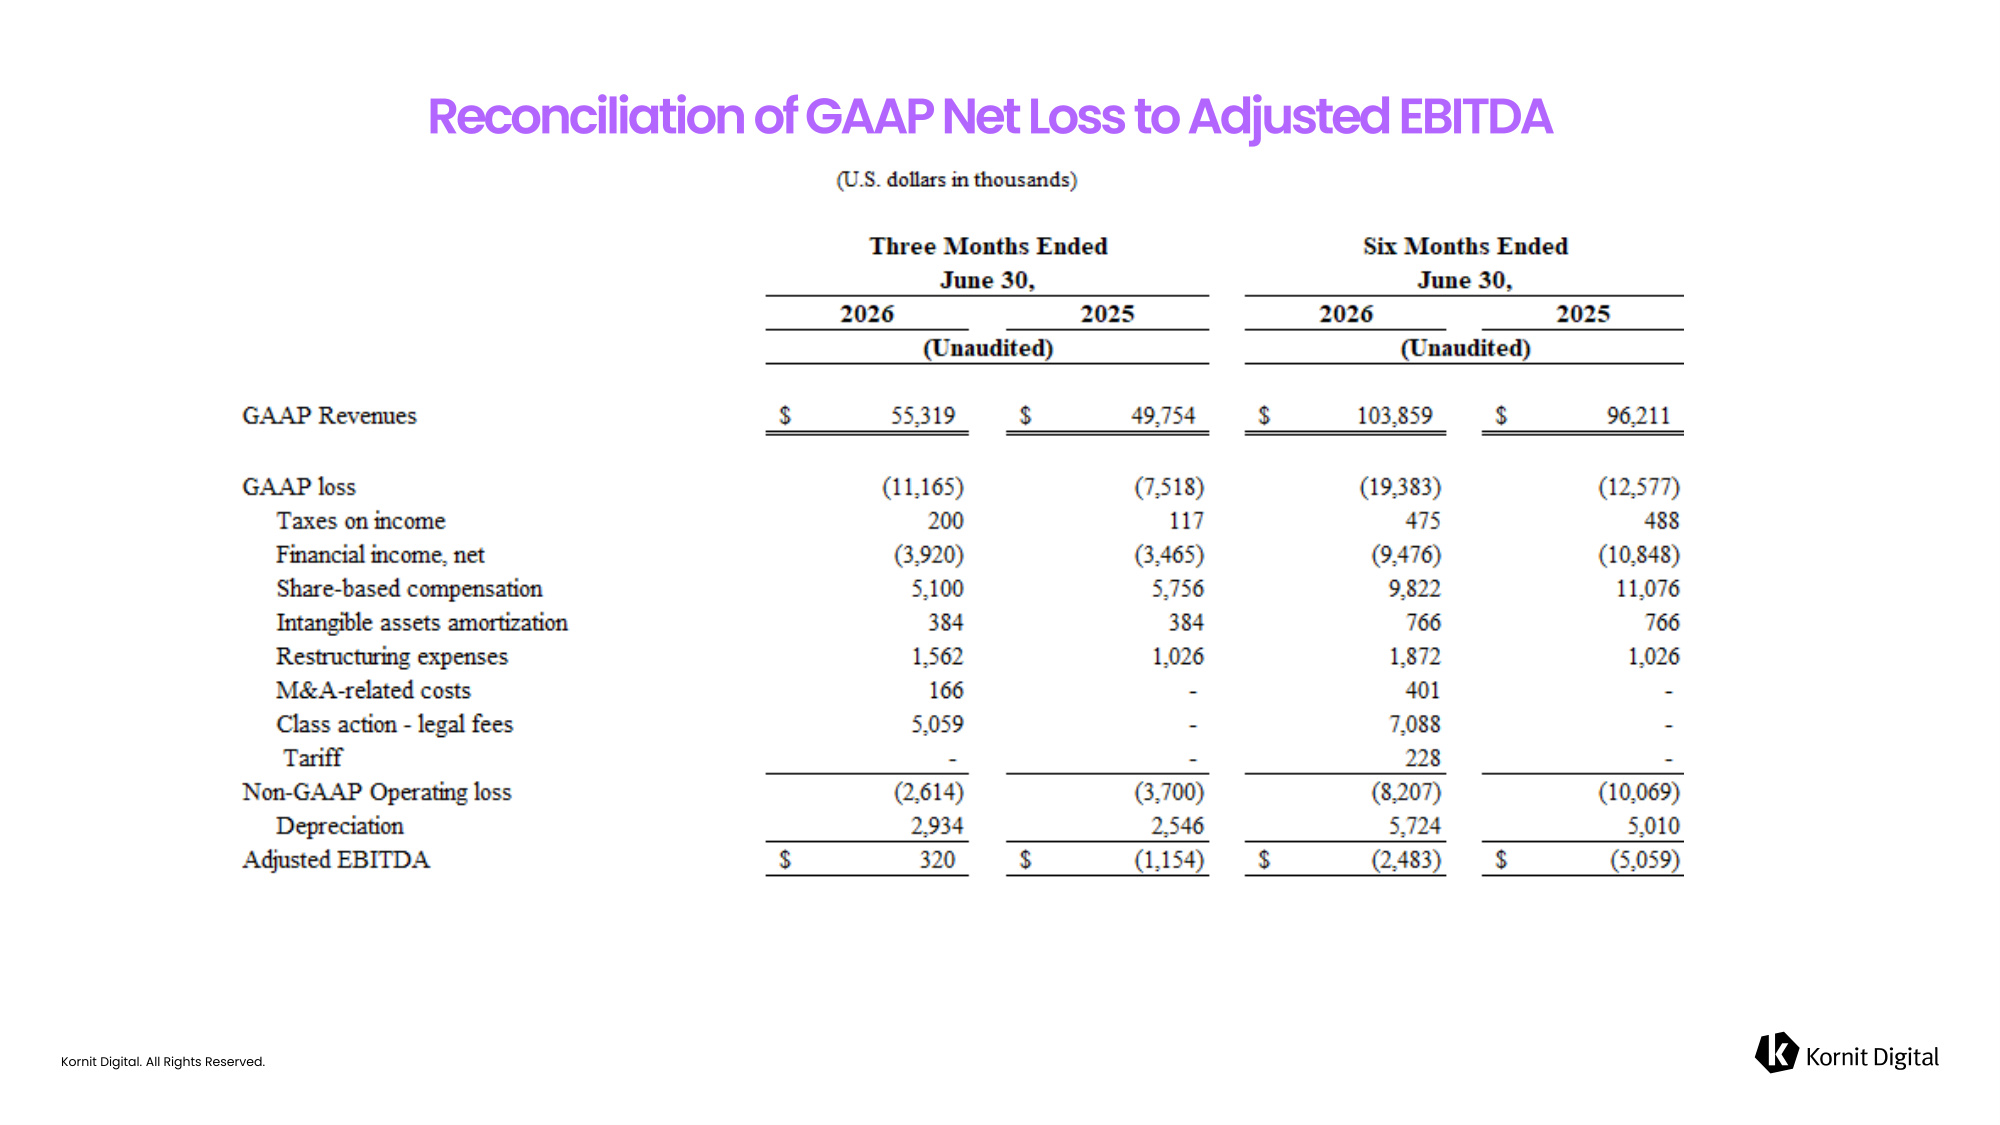
The Company defines “Adjusted EBITDA” as non-GAAP operating income (loss), which reflects the adjustments described in the preceding paragraph to the Company’s GAAP net income (loss), as further adjusted to exclude depreciation expense.
The purpose of the foregoing non-GAAP financial measures is to convey the Company’s performance exclusive of non-cash charges and other items that are considered by management to be outside of the Company’s core operating results. These non-GAAP measures are among the primary factors management uses in planning for and forecasting future periods. Furthermore, the non-GAAP measures are regularly used internally to understand, manage, and evaluate the Company’s business and make operating decisions, and the Company believes that they are useful to investors as a consistent and comparable measure of the ongoing performance of the Company’s business. The Company’s non-GAAP financial measures are not meant to be considered in isolation or as a substitute for comparable GAAP measures and should be read only in conjunction with the Company’s consolidated financial statements prepared in accordance with GAAP. Additionally, these non-GAAP financial measures may differ materially from the non-GAAP financial measures used by other companies.
The reconciliation tables included below present a reconciliation of our non-GAAP financial measures to the most directly comparable GAAP financial measures for our results for the second quarter of 2026. We have not provided, however, in this press release guidance for our expected GAAP net loss margin in the third quarter of 2026, or a reconciliation of our guidance for Adjusted EBITDA margin in the third quarter of 2026 to the most directly comparable GAAP financial measure for that quarter (i.e., GAAP net loss margin), as the information needed to provide that GAAP guidance and that reconciliation is not available to us without unreasonable effort or with reasonable certainty from a quantitative perspective. We expect that the foregoing missing information related to our outlook on a GAAP basis for the third quarter of 2026 is likely to yield significant changes relative to our non-GAAP outlook in respect of the subject financial measure.
Investor Contact
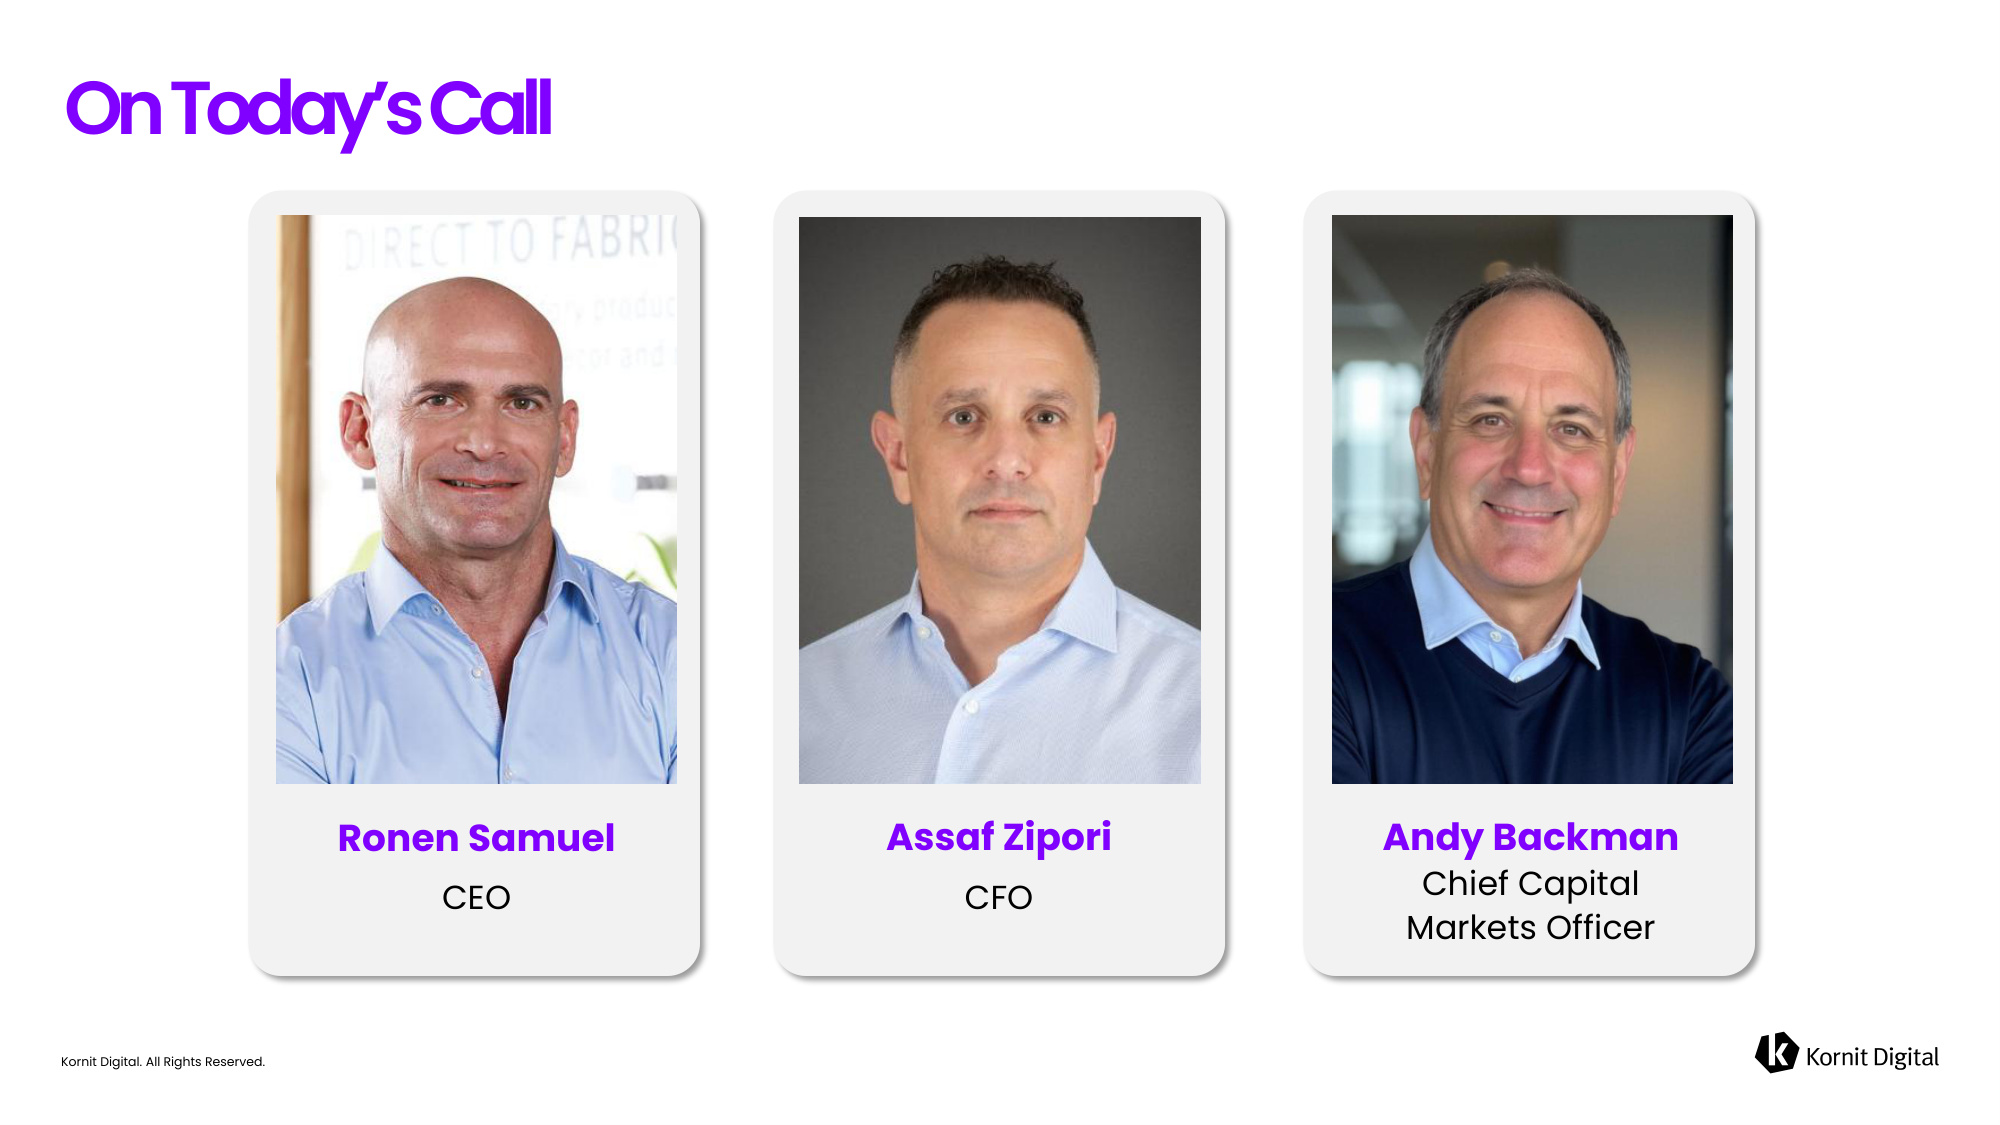
Andrew G. Backman
Chief Capital Markets Officer
Andrew.Backman@kornit.com
4
KORNIT DIGITAL LTD.
AND ITS SUBSIDIARIES
CONSOLIDATED BALANCE SHEETS
(U.S. dollars in thousands)
| June 30, | December 31, | |||||||
| 2026 | 2025 | |||||||
| (Unaudited) | (Audited) | |||||||
| ASSETS | ||||||||
| CURRENT ASSETS: | ||||||||
| Cash and cash equivalents | $ | 33,806 | $ | 35,476 | ||||
| Short-term bank deposit | 339,596 | 368,446 | ||||||
| Marketable securities | 56,329 | 53,926 | ||||||
| Trade receivables, net | 52,320 | 60,796 | ||||||
| Inventory | 54,159 | 47,211 | ||||||
| Other accounts receivable and prepaid expenses | 35,690 | 29,661 | ||||||
| Total current assets | 571,900 | 595,516 | ||||||
| LONG-TERM ASSETS: | ||||||||
| Marketable securities | 21,151 | 33,332 | ||||||
| Severance pay fund | 422 | 385 | ||||||
| Property,plant and equipment, net | 71,984 | 69,492 | ||||||
| Operating lease right-of-use assets | 16,350 | 17,174 | ||||||
| Intangible assets, net | 18,396 | 9,429 | ||||||
| Goodwill | 32,825 | 29,164 | ||||||
| Other long-term assets | 18,325 | 16,018 | ||||||
| Total long-term assets | 179,453 | 174,994 | ||||||
| Total assets | 751,353 | 770,510 | ||||||
| LIABILITIES AND SHAREHOLDERS’ EQUITY | ||||||||
| CURRENT LIABILITIES: | ||||||||
| Trade payables | 18,055 | 6,059 | ||||||
| Employees and payroll accruals | 15,811 | 13,214 | ||||||
| Deferred revenues and advances from customers | 1,636 | 1,529 | ||||||
| Operating lease liabilities | 4,248 | 3,886 | ||||||
| Other payables and accrued expenses | 25,198 | 17,305 | ||||||
| Total current liabilities | 64,948 | 41,993 | ||||||
| LONG-TERM LIABILITIES: | ||||||||
| Deferred tax liability | 1,785 | - | ||||||
| Accrued severance pay | 1,237 | 1,155 | ||||||
| Operating lease liabilities | 14,060 | 14,727 | ||||||
| Other long-term liabilities | 3,545 | 62 | ||||||
| Total long-term liabilities | 20,627 | 15,944 | ||||||
| SHAREHOLDERS’ EQUITY | 665,778 | 712,573 | ||||||
| Total liabilities and shareholders’ equity | $ | 751,353 | $ | 770,510 | ||||
5
KORNIT DIGITAL LTD.
AND ITS SUBSIDIARIES
CONSOLIDATED STATEMENTS OF OPERATIONS
(U.S. dollars in thousands, except share and per share data)
| Three Months Ended | Six Months Ended | |||||||||||||||
| June 30, | June 30, | |||||||||||||||
| 2026 | 2025 | 2026 | 2025 | |||||||||||||
| (Unaudited) | (Unaudited) | |||||||||||||||
| Revenues | ||||||||||||||||
| Products | $ | 40,047 | $ | 38,413 | $ | 75,127 | $ | 72,278 | ||||||||
| Services | 15,272 | 11,341 | 28,732 | 23,933 | ||||||||||||
| Total revenues | 55,319 | 49,754 | 103,859 | 96,211 | ||||||||||||
| Cost of revenues | ||||||||||||||||
| Products | 17,135 | 17,967 | 33,955 | 33,580 | ||||||||||||
| Services | 13,120 | 11,043 | 26,450 | 22,087 | ||||||||||||
| Total cost of revenues | 30,255 | 29,010 | 60,405 | 55,667 | ||||||||||||
| Gross profit | 25,064 | 20,744 | 43,454 | 40,544 | ||||||||||||
| Operating expenses: | ||||||||||||||||
| Research and development, net | 9,158 | 9,143 | 18,785 | 18,421 | ||||||||||||
| Sales and marketing | 18,078 | 14,993 | 31,126 | 29,942 | ||||||||||||
| General and administrative | 12,713 | 7,474 | 21,927 | 15,118 | ||||||||||||
| Total operating expenses | 39,949 | 31,610 | 71,838 | 63,481 | ||||||||||||
| Operating loss | (14,885 | ) | (10,866 | ) | (28,384 | ) | (22,937 | ) | ||||||||
| Financial income, net | 3,920 | 3,465 | 9,476 | 10,848 | ||||||||||||
| Loss before taxes on income | (10,965 | ) | (7,401 | ) | (18,908 | ) | (12,089 | ) | ||||||||
| Taxes on income | 200 | 117 | 475 | 488 | ||||||||||||
| Net loss | $ | (11,165 | ) | $ | (7,518 | ) | $ | (19,383 | ) | $ | (12,577 | ) | ||||
| Basic net loss per share | $ | (0.26 | ) | $ | (0.17 | ) | $ | (0.45 | ) | $ | (0.28 | ) | ||||
| Weighted average number of shares used in computing basic net loss per share | 42,872,109 | 45,164,493 | 43,552,778 | 45,482,748 | ||||||||||||
| Diluted net loss per share | $ | (0.26 | ) | $ | (0.17 | ) | $ | (0.45 | ) | $ | (0.28 | ) | ||||
| Weighted average number of shares used in computing diluted net loss per share | 42,872,109 | 45,164,493 | 43,552,778 | 45,482,748 | ||||||||||||
6
KORNIT DIGITAL LTD.
AND ITS SUBSIDIARIES
RECONCILIATION OF GAAP TO NON-GAAP CONSOLIDATED STATEMENTS OF OPERATIONS
(U.S. dollars in thousands, except share and per share data)
| Three Months Ended | Six Months Ended | |||||||||||||||
| June 30, | June 30, | |||||||||||||||
| 2026 | 2025 | 2026 | 2025 | |||||||||||||
| (Unaudited) | (Unaudited) | |||||||||||||||
| Revenues | $ | 55,319 | $ | 49,754 | $ | 103,859 | $ | 96,211 | ||||||||
| GAAP cost of revenues | $ | 30,255 | $ | 29,010 | $ | 60,405 | $ | 55,667 | ||||||||
| Cost of product recorded for share-based compensation (1) | (441 | ) | (542 | ) | (882 | ) | (1,061 | ) | ||||||||
| Cost of service recorded for share-based compensation (1) | (408 | ) | (404 | ) | (762 | ) | (799 | ) | ||||||||
| Intangible assets amortization on cost of product (2) | (150 | ) | (150 | ) | (298 | ) | (298 | ) | ||||||||
| Intangible assets amortization on cost of service (2) | (160 | ) | (160 | ) | (320 | ) | (320 | ) | ||||||||
| Restructuring expenses (3) | - | (1,026 | ) | (167 | ) | (1,026 | ) | |||||||||
| Tariff (6) | - | - | (228 | ) | - | |||||||||||
| Non-GAAP cost of revenues | $ | 29,096 | $ | 26,728 | $ | 57,748 | $ | 52,163 | ||||||||
| GAAP gross profit | $ | 25,064 | $ | 20,744 | $ | 43,454 | $ | 40,544 | ||||||||
| Gross profit adjustments | 1,159 | 2,282 | 2,657 | 3,504 | ||||||||||||
| Non-GAAP gross profit | $ | 26,223 | $ | 23,026 | $ | 46,111 | $ | 44,048 | ||||||||
| GAAP operating expenses | $ | 39,949 | $ | 31,610 | $ | 71,838 | $ | 63,481 | ||||||||
| Share-based compensation (1) | (4,251 | ) | (4,810 | ) | (8,178 | ) | (9,216 | ) | ||||||||
| Intangible assets amortization (2) | (74 | ) | (74 | ) | (148 | ) | (148 | ) | ||||||||
| Restructuring expenses (3) | (1,562 | ) | - | (1,705 | ) | - | ||||||||||
| M&A-related costs (4) | (166 | ) | - | (401 | ) | - | ||||||||||
| Class action - legal fees (5) | (5,059 | ) | - | (7,088 | ) | - | ||||||||||
| Non-GAAP operating expenses | $ | 28,837 | $ | 26,726 | $ | 54,318 | $ | 54,117 | ||||||||
| GAAP Financial income, net | $ | 3,920 | $ | 3,475 | $ | 9,476 | $ | 10,848 | ||||||||
| Foreign exchange loss associated with ASC 842 | 617 | 1,568 | 484 | 1,535 | ||||||||||||
| Non-GAAP Financial income, net | $ | 4,537 | $ | 5,043 | $ | 9,960 | $ | 12,383 | ||||||||
| GAAP Taxes on income | $ | 200 | $ | 117 | $ | 475 | $ | 488 | ||||||||
| Non-GAAP Taxes on income | $ | 200 | $ | 117 | $ | 475 | $ | 488 | ||||||||
| GAAP Net loss | $ | (11,165 | ) | $ | (7,518 | ) | $ | (19,383 | ) | $ | (12,577 | ) | ||||
| Share-based compensation (1) | 5,100 | 5,756 | 9,822 | 11,076 | ||||||||||||
| Intangible assets amortization (2) | 384 | 384 | 766 | 766 | ||||||||||||
| Restructuring expenses (3) | 1,562 | 1,026 | 1,872 | 1,026 | ||||||||||||
| Foreign exchange loss associated with ASC 842 | 617 | 1,578 | 484 | 1,535 | ||||||||||||
| M&A-related costs (4) | 166 | - | 401 | - | ||||||||||||
| Class action - legal fees (5) | 5,059 | - | 7,088 | - | ||||||||||||
| Tariff (6) | - | - | 228 | - | ||||||||||||
| Non-GAAP net income | $ | 1,723 | $ | 1,226 | $ | 1,278 | $ | 1,826 | ||||||||
| GAAP diluted net loss per share | $ | (0.26 | ) | $ | (0.17 | ) | $ | (0.45 | ) | $ | (0.28 | ) | ||||
| Non-GAAP diluted net income per share | $ | 0.04 | $ | 0.03 | $ | 0.03 | $ | 0.04 | ||||||||
| Weighted average number of shares | ||||||||||||||||
| Shares used in computing GAAP diluted net loss per share | 42,872,109 | 45,164,493 | 43,552,778 | 45,482,748 | ||||||||||||
| Shares used in computing Non-GAAP diluted net income per share | 44,915,179 | 45,508,379 | 45,852,936 | 45,931,988 | ||||||||||||
| (1) Share-based compensation | ||||||||||||||||
| Cost of product revenues | $ | 441 | $ | 542 | $ | 882 | $ | 1,061 | ||||||||
| Cost of service revenues | 408 | 404 | 762 | 799 | ||||||||||||
| Research and development | 1,009 | 1,213 | 1,954 | 2,415 | ||||||||||||
| Sales and marketing | 1,687 | 1,831 | 3,195 | 3,368 | ||||||||||||
| General and administrative | 1,555 | 1,766 | 3,029 | 3,433 | ||||||||||||
| $ | 5,100 | $ | 5,756 | $ | 9,822 | $ | 11,076 | |||||||||
| (2) Intangible assets amortization | ||||||||||||||||
| Cost of product revenues | $ | 150 | $ | 150 | $ | 298 | $ | 298 | ||||||||
| Cost of service revenues | 160 | 160 | 320 | 320 | ||||||||||||
| Sales and marketing | 74 | 74 | 148 | 148 | ||||||||||||
| $ | 384 | $ | 384 | $ | 766 | $ | 766 | |||||||||
| (3) Restructuring expenses | ||||||||||||||||
| Cost of product revenues | $ | - | $ | 1,026 | $ | - | $ | 1,026 | ||||||||
| Cost of service revenues | - | - | 167 | - | ||||||||||||
| Research and development | - | - | 87 | - | ||||||||||||
| Sales and marketing | 1,537 | - | 1,581 | - | ||||||||||||
| General and administrative | 25 | - | 37 | - | ||||||||||||
| $ | 1,562 | $ | 1,026 | $ | 1,872 | $ | 1,026 | |||||||||
| (4) M&A-related costs | ||||||||||||||||
| General and administrative | $ | 166 | $ | - | $ | 401 | $ | - | ||||||||
| (5) Class action - legal fees | ||||||||||||||||
| General and administrative | $ | 5,059 | $ | - | $ | 7,088 | $ | - | ||||||||
| (6) Tariff | ||||||||||||||||
| Cost of product revenues | $ | - | $ | - | $ | 228 | $ | - | ||||||||
7
KORNIT DIGITAL LTD.
AND ITS SUBSIDIARIES
CONSOLIDATED STATEMENTS OF CASH FLOWS
(U.S. dollars in thousands)
| Three Months Ended | Six Months Ended | |||||||||||||||
| June 30, | June 30, | |||||||||||||||
| 2026 | 2025 | 2026 | 2025 | |||||||||||||
| (Unaudited) | (Unaudited) | |||||||||||||||
| Cash flows from operating activities: | ||||||||||||||||
| Net loss | $ | (11,162 | ) | $ | (7,518 | ) | $ | (19,383 | ) | $ | (12,577 | ) | ||||
| Adjustments to reconcile net loss to net cash provided by operating activities: | ||||||||||||||||
| Depreciation and amortization | 3,318 | 2,930 | 6,490 | 5,776 | ||||||||||||
| Impairment of long-lived assets | 1,264 | - | 1,264 | - | ||||||||||||
| Share-based compensation | 5,100 | 5,756 | 9,822 | 11,076 | ||||||||||||
| Amortization of premium and accretion of discount on marketable securities, net | (87 | ) | (246 | ) | (218 | ) | (550 | ) | ||||||||
| Realized loss on sale and redemption of marketable securities | (61 | ) | - | (63 | ) | (22 | ) | |||||||||
| Loss from disposal of property and Equipments | - | 134 | - | 134 | ||||||||||||
| Change in operating assets and liabilities: | ||||||||||||||||
| Trade receivables, net | (2,674 | ) | (3,046 | ) | 9,216 | 1,002 | ||||||||||
| Other accounts receivables and prepaid expenses | (3,086 | ) | (1,507 | ) | (5,499 | ) | (2,872 | ) | ||||||||
| Inventory | 9 | 5,280 | (6,741 | ) | 7,600 | |||||||||||
| Operating leases right-of-use assets and liabilities, net | 634 | 1,590 | 519 | 1,430 | ||||||||||||
| Other long term assets | 141 | (3,234 | ) | (2,316 | ) | (3,547 | ) | |||||||||
| Trade payables | 7,570 | 5,403 | 10,390 | 93 | ||||||||||||
| Employees and payroll accruals | 3,377 | (438 | ) | 3,611 | 1,654 | |||||||||||
| Deferred revenues and advances from customers | (1,200 | ) | (227 | ) | (1,202 | ) | (773 | ) | ||||||||
| Other payables and accrued expenses | 5,417 | (531 | ) | 7,366 | 1,699 | |||||||||||
| Accrued severance pay, net | (58 | ) | (588 | ) | 45 | (617 | ) | |||||||||
| Other long - term liabilities | 6 | (28 | ) | 29 | (12 | ) | ||||||||||
| Net cash provided by operating activities | 8,508 | 3,730 | 13,330 | 9,494 | ||||||||||||
| Cash flows from investing activities: | ||||||||||||||||
| Purchase of property, plant and equipment and capitalized software development costs | (6,740 | ) | (5,808 | ) | (10,781 | ) | (9,579 | ) | ||||||||
| Proceeds from (investment in) short-term bank deposits, net | 19,200 | (79,503 | ) | 28,850 | (100,503 | ) | ||||||||||
| Proceeds from sales and redemption of marketable securities | 4,750 | 3,260 | 8,000 | 6,060 | ||||||||||||
| Proceeds from maturities of marketable securities | 13,150 | 77,802 | 24,320 | 143,122 | ||||||||||||
| Investment in marketable securities | (22,698 | ) | (6,763 | ) | (22,698 | ) | (32,578 | ) | ||||||||
| Cash paid in connection with acquisition, net of cash acquired | (5,820 | ) | - | (5,820 | ) | - | ||||||||||
| Net cash provided by (used in) investing activities | 1,842 | (11,012 | ) | 21,871 | 6,522 | |||||||||||
| Cash flows from financing activities: | ||||||||||||||||
| Exercise of employee stock options | 161 | 239 | 190 | 768 | ||||||||||||
| Payments related to shares withheld for taxes | (392 | ) | (392 | ) | (1,055 | ) | (1,369 | ) | ||||||||
| Repurchase of ordinary shares | (6,977 | ) | (23,176 | ) | (37,486 | ) | (25,000 | ) | ||||||||
| Increase in other financial liabilities | - | - | 1,480 | - | ||||||||||||
| Net cash used in financing activities | (7,208 | ) | (23,329 | ) | (36,871 | ) | (25,601 | ) | ||||||||
| Increase (decrease) in cash and cash equivalents | 3,142 | (30,611 | ) | (1,670 | ) | (9,585 | ) | |||||||||
| Cash and cash equivalents at the beginning of the period | 30,664 | 56,029 | 35,476 | 35,003 | ||||||||||||
| Cash and cash equivalents at the end of the period | $ | 33,806 | $ | 25,418 | $ | 33,806 | $ | 25,418 | ||||||||
| Non-cash investing and financing activities: | ||||||||||||||||
| Purchase of property and equipment on credit | 450 | 1,167 | 853 | 1,167 | ||||||||||||
| Inventory transferred to be used as property and equipment | 798 | 2,548 | 844 | 2,953 | ||||||||||||
| Property, plant and equipment transferred to be used as inventory | 970 | 234 | 1,047 | 234 | ||||||||||||
| Lease liabilities arising from obtaining right-of-use assets | 390 | 561 | 1,029 | 1,083 | ||||||||||||
| Fair value of contingent obligations to selling shareholders provided as consideration for business combination | 2,443 | - | 2,443 | - | ||||||||||||
8
KORNIT DIGITAL LTD.
AND ITS SUBSIDIARIES
RECONCILIATION OF GAAP NET LOSS TO ADJUSTED EBITDA
(U.S. dollars in thousands)
| Three Months Ended | Six Months Ended | |||||||||||||||
| June 30, | June 30, | |||||||||||||||
| 2026 | 2025 | 2026 | 2025 | |||||||||||||
| (Unaudited) | (Unaudited) | |||||||||||||||
| GAAP Revenues | $ | 55,319 | $ | 49,754 | $ | 103,859 | $ | 96,211 | ||||||||
| GAAP loss | (11,165 | ) | (7,518 | ) | (19,383 | ) | (12,577 | ) | ||||||||
| Taxes on income | 200 | 117 | 475 | 488 | ||||||||||||
| Financial income, net | (3,920 | ) | (3,465 | ) | (9,476 | ) | (10,848 | ) | ||||||||
| Share-based compensation | 5,100 | 5,756 | 9,822 | 11,076 | ||||||||||||
| Intangible assets amortization | 384 | 384 | 766 | 766 | ||||||||||||
| Restructuring expenses | 1,562 | 1,026 | 1,872 | 1,026 | ||||||||||||
| M&A-related costs | 166 | - | 401 | - | ||||||||||||
| Class action - legal fees | 5,059 | - | 7,088 | - | ||||||||||||
| Tariff | - | - | 228 | - | ||||||||||||
| Non-GAAP Operating loss | (2,614 | ) | (3,700 | ) | (8,207 | ) | (10,069 | ) | ||||||||
| Depreciation | 2,934 | 2,546 | 5,724 | 5,010 | ||||||||||||
| Adjusted EBITDA | $ | 320 | $ | (1,154 | ) | $ | (2,483 | ) | $ | (5,059 | ) | |||||
9
Exhibit 99.2
Kornit Digital. All Rights Reserved. Kornit Digital. All Rights Reserved. Kornit Digital (NASDAQ: KRNT) Second Quarter 2026 Earnings Conference Call Supporting Slides August 12, 2026 Kornit Digital. All Rights Reserved.
Kornit Digital. All Rights Reserved. On Today's Call Ronen Samuel CEO Assaf Zipori CFO Andy Backman Chief Capital Markets Officer
Kornit Digital. All Rights Reserved. Safe Harbor - Use of Non-GAAP Measures This presentation contains "forward-looking statements" within the meaning of the Private Securities Litigation Reform Act of 1995 and other U.S. securities laws. Forward-looking statements are characterized by the use of forward-looking terminology such as "will," "expects," "anticipates," "believes," "intends," "planned," or other similar words. These forward-looking statements include, but are not limited to, statements relating to the Company's objectives, plans and strategies, including the Company's AIC program, statements regarding the Company's results of operations and financial condition, including the Company's guidance for the third quarter of 2026, and all statements that address developments that the Company expects or anticipates will or may occur in the future. Forward-looking statements are not guarantees of future performance and are subject to risks and uncertainties. The Company has based these forward-looking statements on assumptions and assessments made by its management in light of their experience and their perception of historical trends, current conditions, expected future developments and other factors they believe to be appropriate. Important factors that could cause actual results, developments and business decisions to differ materially from those anticipated in these forward-looking statements include, among other things: the Company's degree of success in developing, introducing and selling new or improved products and product enhancements including specifically, the Company's Presto products, the Company's Atlas family of products and the Apollo direct-to-garment platform; the extent of the Company's ability to increase sales of its systems, ink and consumables; the extent of the Company's ability to continue to grow customer adoption of the AIC model; the development of the market for digital textile printing generally; the Company's securities class action-related fees; and those additional factors referred to under "Risk Factors" in Item 3.D of the Company's Annual Report on Form 20-F for the year ended December 31, 2025, filed with the SEC on March 26, 2026. Any forward-looking statements in this presentation are made as of the date hereof, and will not be updated by the Company, whether as a result of new information, future events or otherwise, except as required by law. In addition to U.S. GAAP financials, this presentation includes certain non-GAAP financial measures. These non-GAAP financial measures are in addition to, and not a substitute for or superior to, measures of financial performance prepared in accordance with U.S. GAAP. Please see the reconciliation table that appears among the financial tables in our earnings release being issued today, which earnings release is attached as Exhibit 99.1 to our report of foreign private issuer on Form 6-K being furnished to the SEC today, which reconciliation table is incorporated by reference in this presentation. Please also see Slide 20 of this presentation. Our non-GAAP guidance for the third quarter of 2026 concerning Adjusted EBITDA margin appearing in this presentation and in today's earnings release is not, however, accompanied by the most directly comparable GAAP financial measure (i.e., GAAP net loss margin), or by a reconciliation between the two, as the information needed to provide that GAAP guidance and that reconciliation is not available to us without unreasonable effort or with reasonable certainty from a quantitative perspective. This presentation contains statistical data that we obtained from industry publications and reports generated by third parties. Although we believe that the publications and reports are reliable, we have not independently verified this statistical data. Kornit, Kornit Digital, the K logo, and NeoPigment are trademarks of Kornit Digital Ltd. All other trademarks are the property of their respective owners and are used for reference purposes only. Such use should not be construed as an endorsement of our products or services.

Kornit Digital. All Rights Reserved. Business Highlights
Kornit Digital. All Rights Reserved. Second Quarter 2026 Recap ARR = Annual Recurring Revenue from AIC reflects the minimum annual revenue commitment derived from all systems shipped under the AIC model at period end TCV = Total Contracted Value defined as remaining contracted value of all AIC agreements in place at period end; These reflect annual contractual commitments which may be terminated sooner by customers subject to a termination fee. Revenue Adjusted EBITDA ARR TCV Impressions $55.3m +11% vs Q2 2025 $0.3m +$1.5m vs Q2 2025 $33.8m +79% vs Q2 2025 ~$142m +$53.6m vs Q2 2025 +15% Y/Y Trailing Twelve-month Basis "These results reinforce that our strategy is working and, importantly, that the quality of our growth is improving"
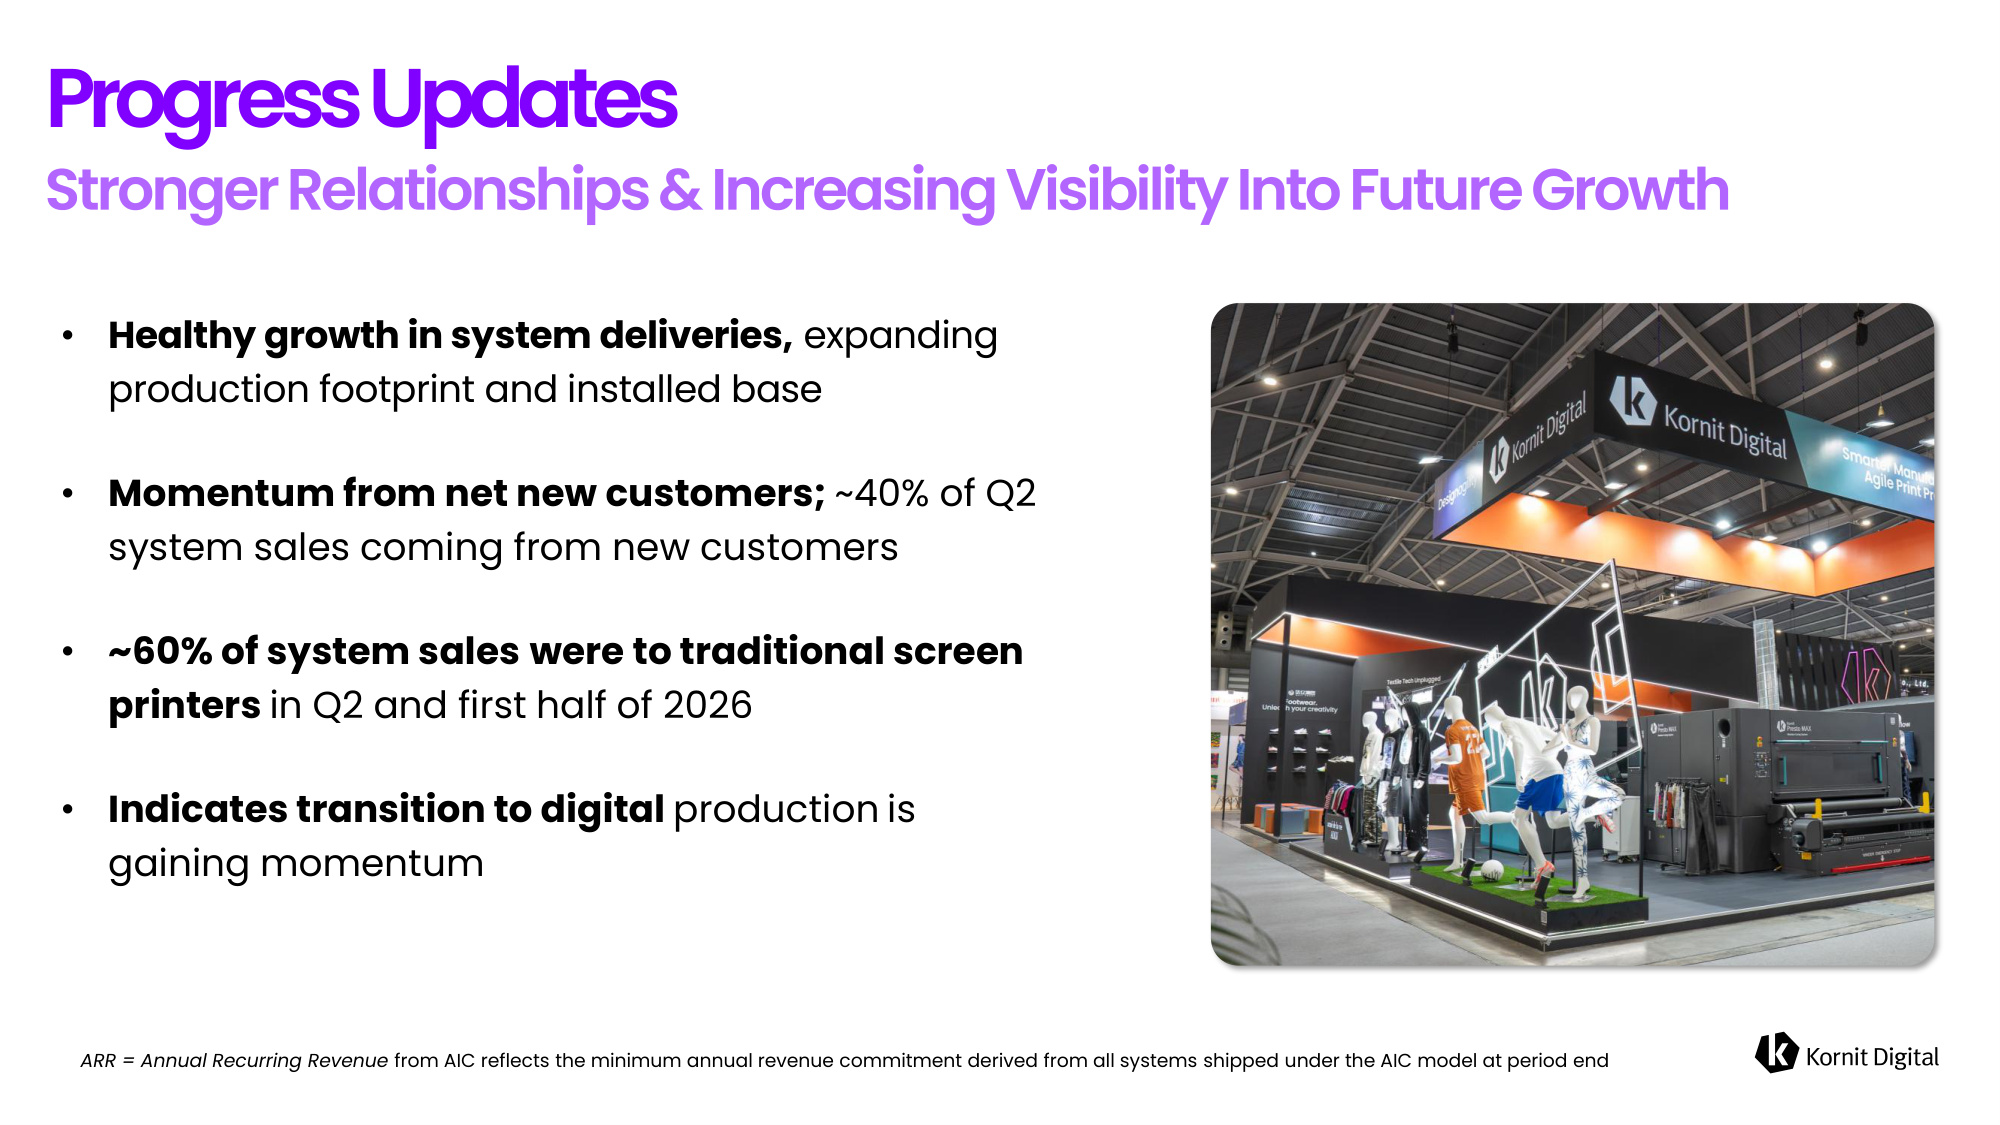
Kornit Digital. All Rights Reserved. • Healthy growth in system deliveries, expanding production footprint and installed base • Momentum from net new customers; ~40% of Q2 system sales coming from new customers • ~60% of system sales were to traditional screen printers in Q2 and first half of 2026 • Indicates transition to digital production is gaining momentum Progress Updates ARR = Annual Recurring Revenue from AIC reflects the minimum annual revenue commitment derived from all systems shipped under the AIC model at period end
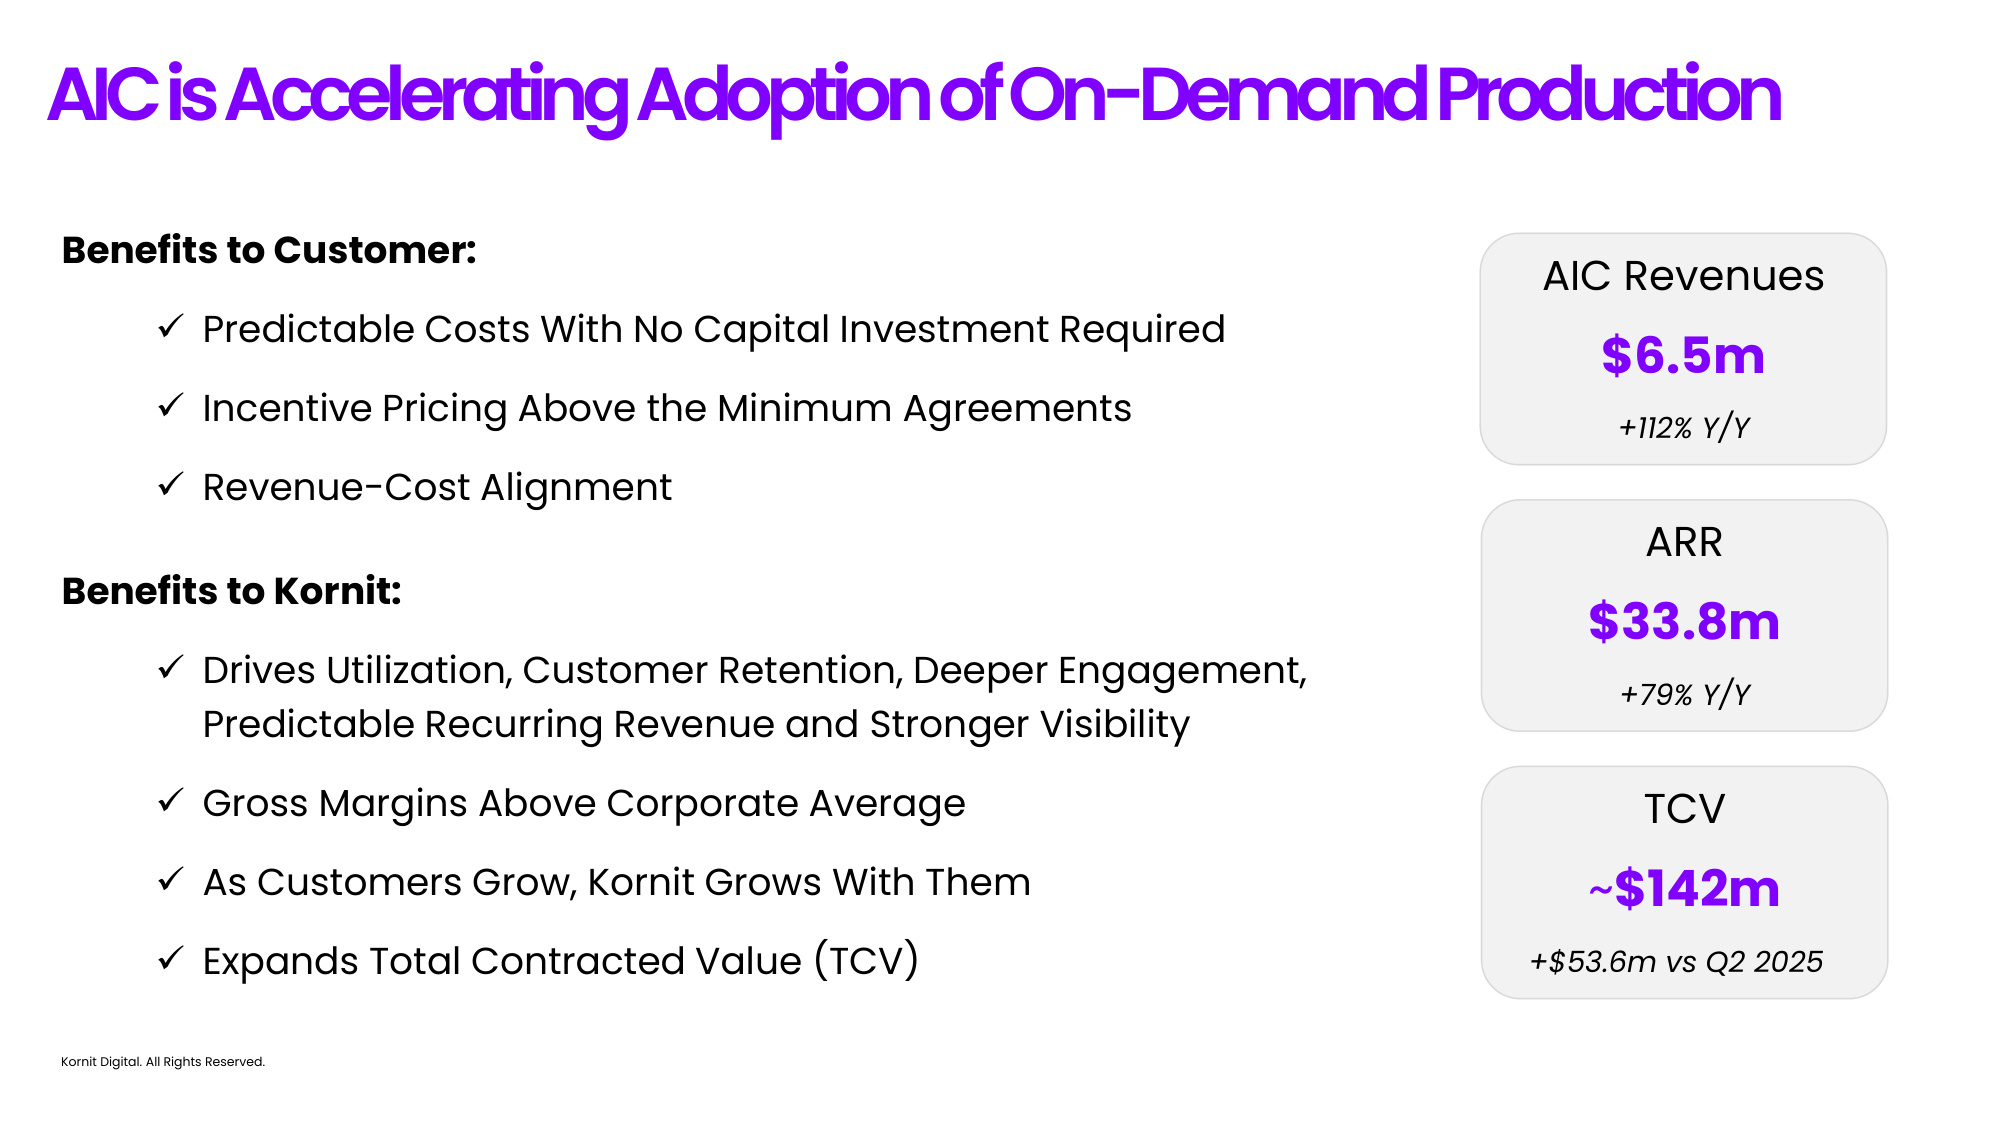
Kornit Digital. All Rights Reserved. ARR $33.8m +79% Y/Y TCV ~$142m +$53.6m vs Q2 2025 AIC Revenues $6.5m +112% Y/Y Benefits to Customer: ✓Predictable Costs With No Capital Investment Required ✓Incentive Pricing Above the Minimum Agreements ✓Revenue-Cost Alignment Benefits to Kornit: ✓Drives Utilization, Customer Retention, Deeper Engagement, Predictable Recurring Revenue and Stronger Visibility ✓Gross Margins Above Corporate Average ✓As Customers Grow, Kornit Grows With Them ✓Expands Total Contracted Value (TCV) AIC is Accelerating Adoption of On-Demand Production
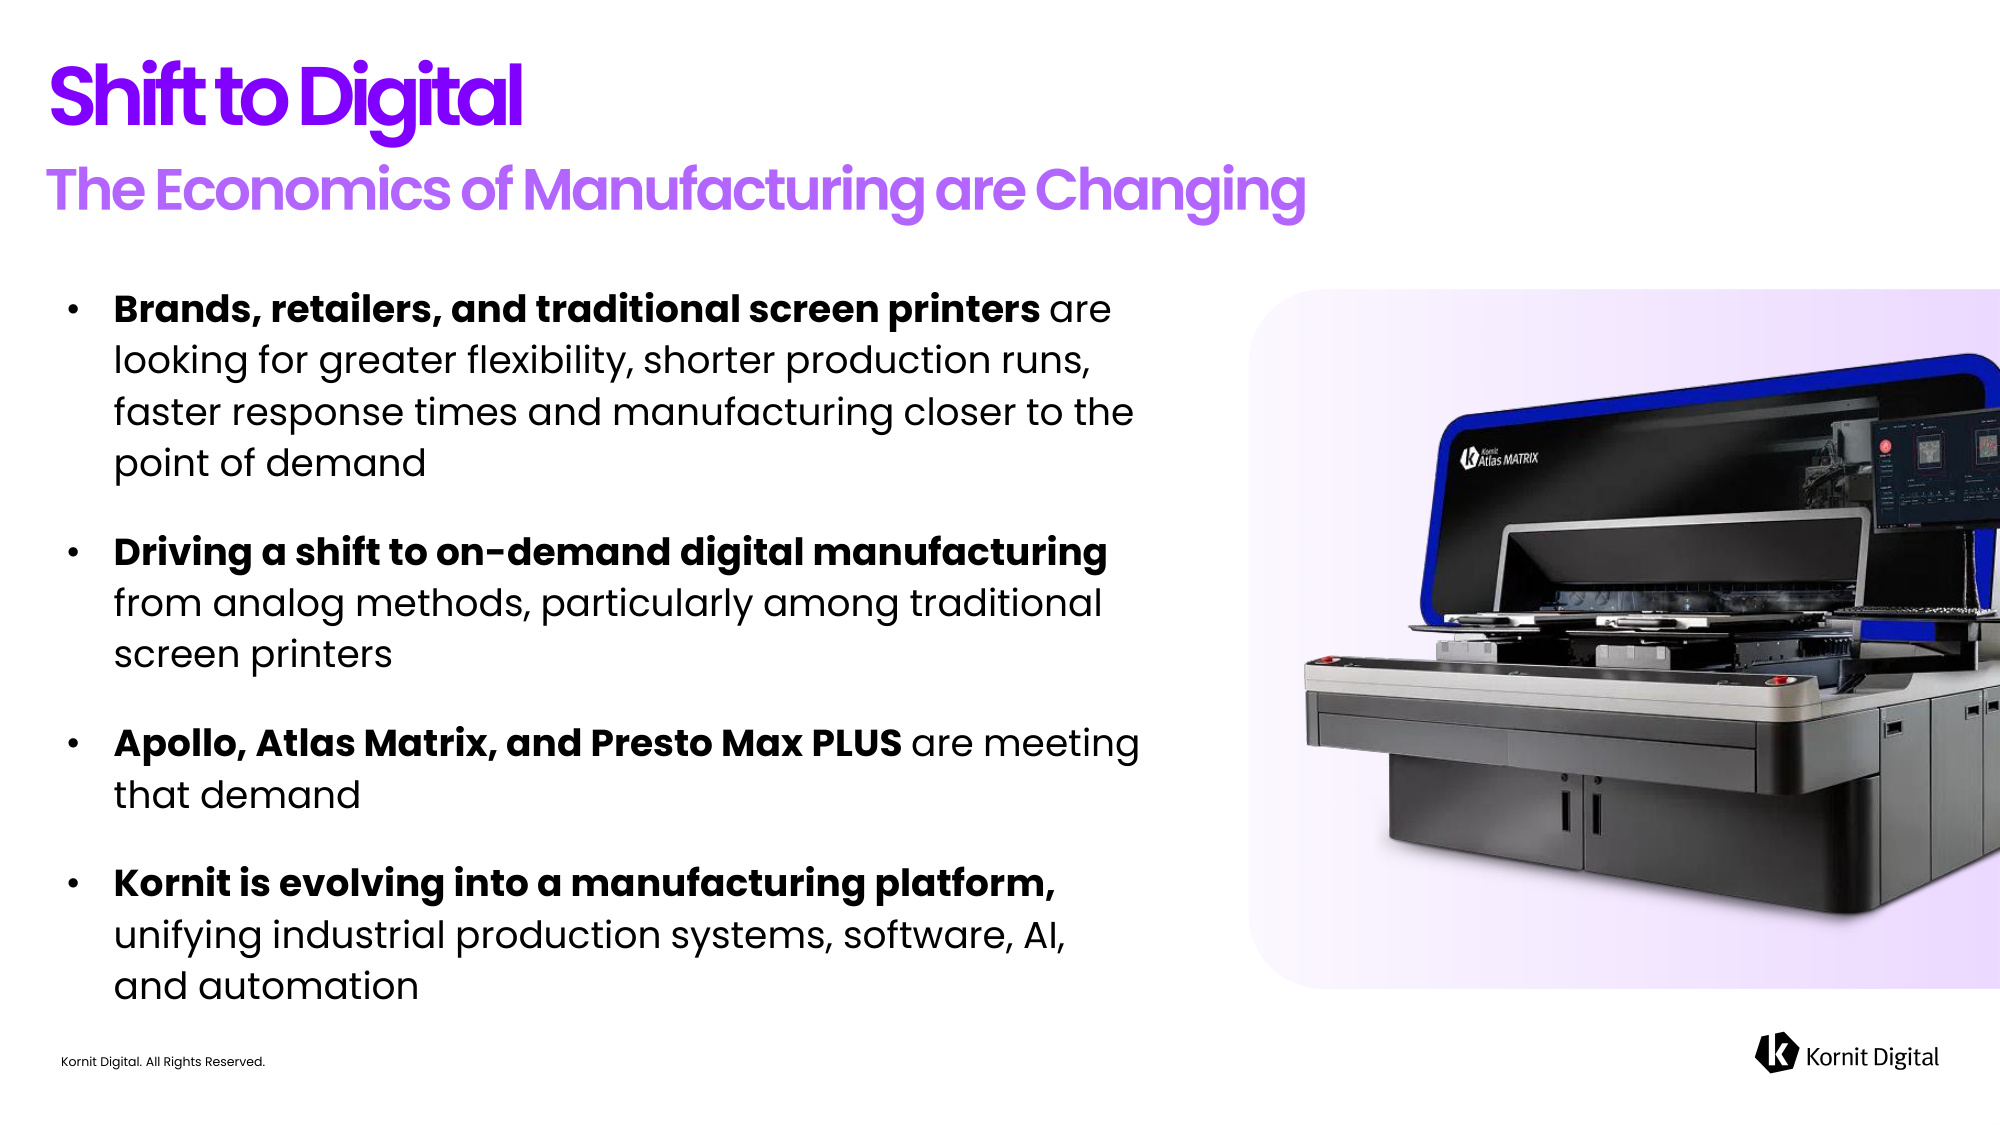
Kornit Digital. All Rights Reserved. Shift to Digital • Brands, retailers, and traditional screen printers are looking for greater flexibility, shorter production runs, faster response times and manufacturing closer to the point of demand • Driving a shift to on-demand digital manufacturing from analog methods, particularly among traditional screen printers • Apollo, Atlas Matrix, and Presto Max PLUS are meeting that demand • Kornit is evolving into a manufacturing platform, unifying industrial production systems, software, AI, and automation
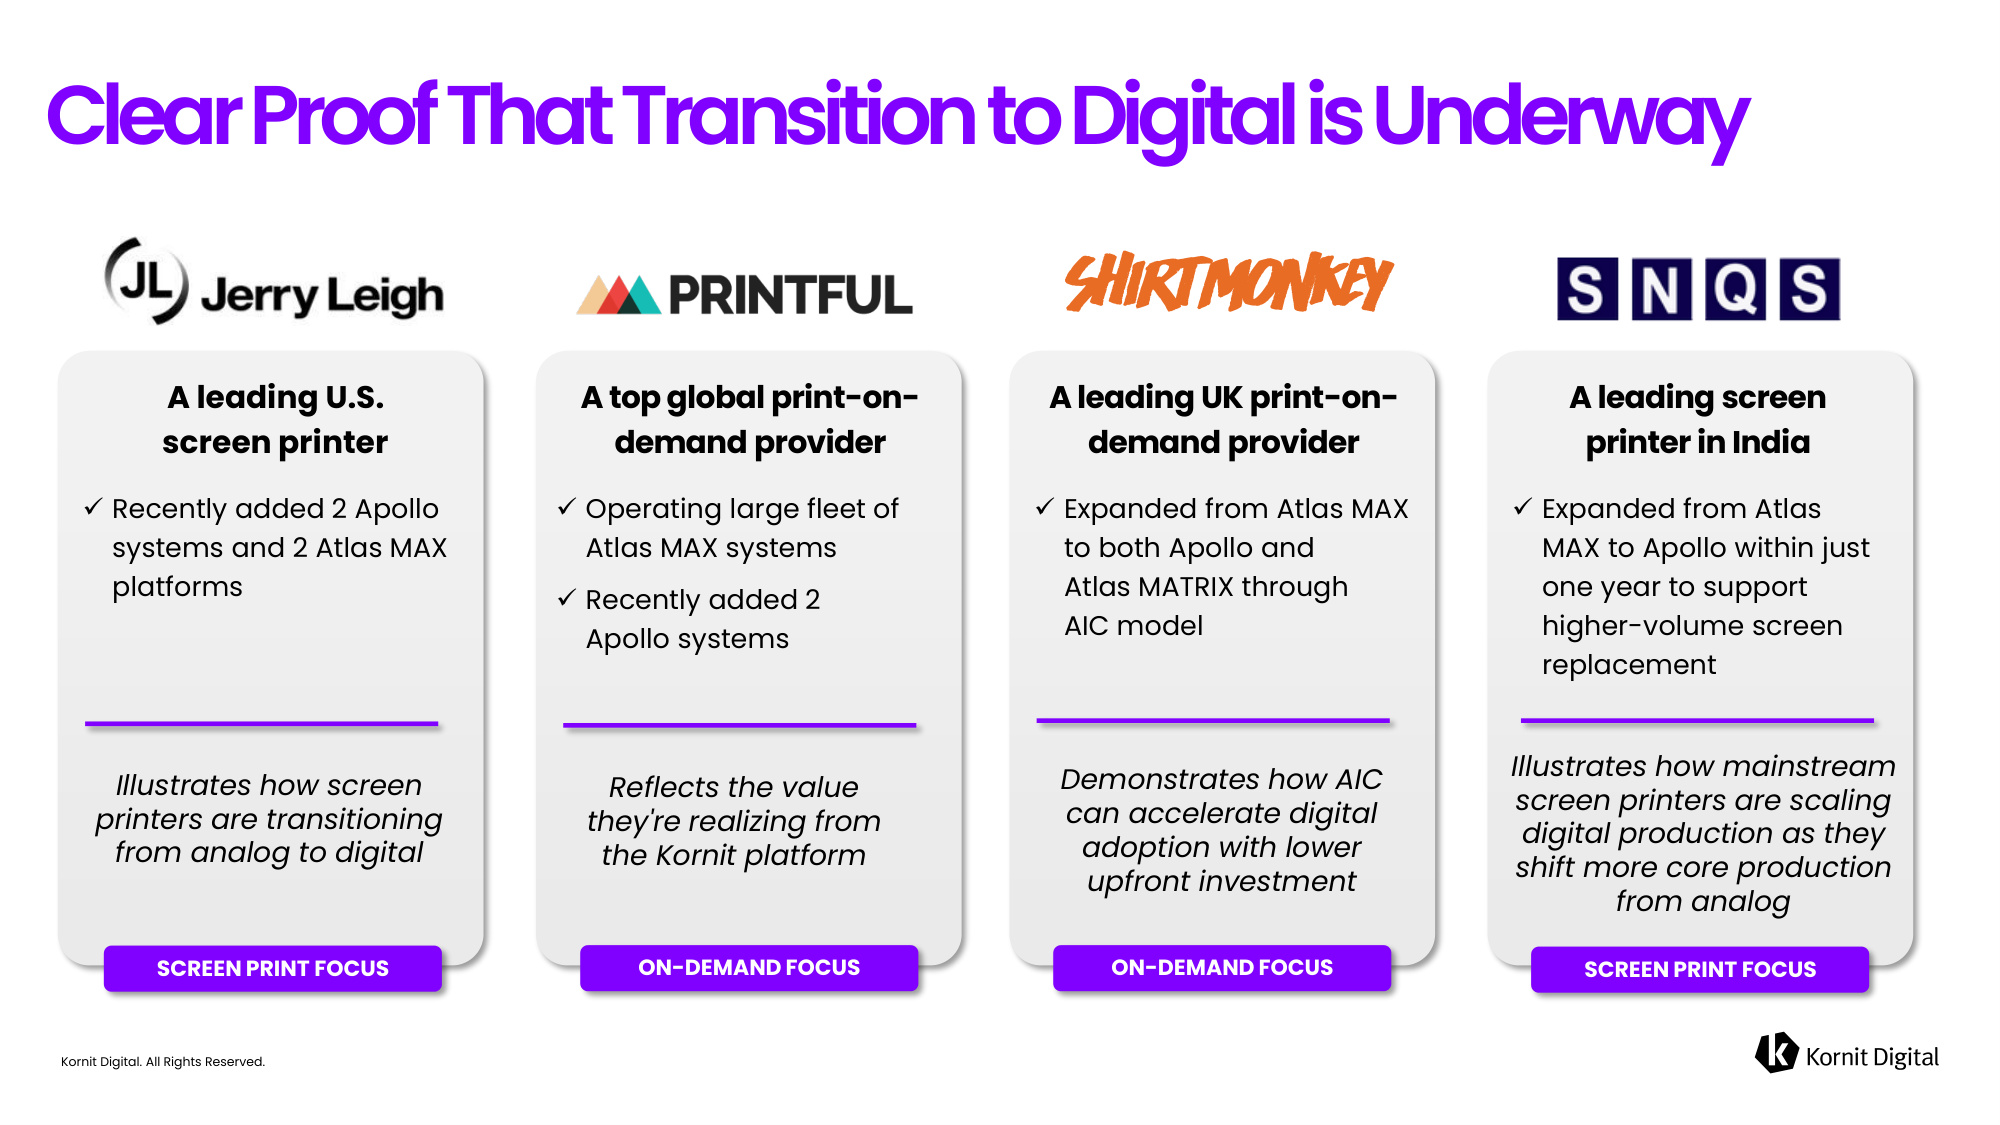
Kornit Digital. All Rights Reserved. Clear Proof That Transition to Digital is Underway A leading U.S. screen printer ✓Recently added 2 Apollo systems and 2 Atlas MAX platforms A top global print-on- demand provider ✓Operating large fleet of Atlas MAX systems ✓Recently added 2 Apollo systems A leading UK print-on- demand provider ✓Expanded from Atlas MAX to both Apollo and Atlas MATRIX through AIC model A leading screen printer in India ✓Expanded from Atlas MAX to Apollo within just one year to support higher-volume screen replacement Illustrates how screen printers are transitioning from analog to digital Reflects the value they're realizing from the Kornit platform Demonstrates how AIC can accelerate digital adoption with lower upfront investment Illustrates how mainstream screen printers are scaling digital production as they shift more core production from analog SCREEN PRINT FOCUS ON-DEMAND FOCUS ON-DEMAND FOCUS SCREEN PRINT FOCUS
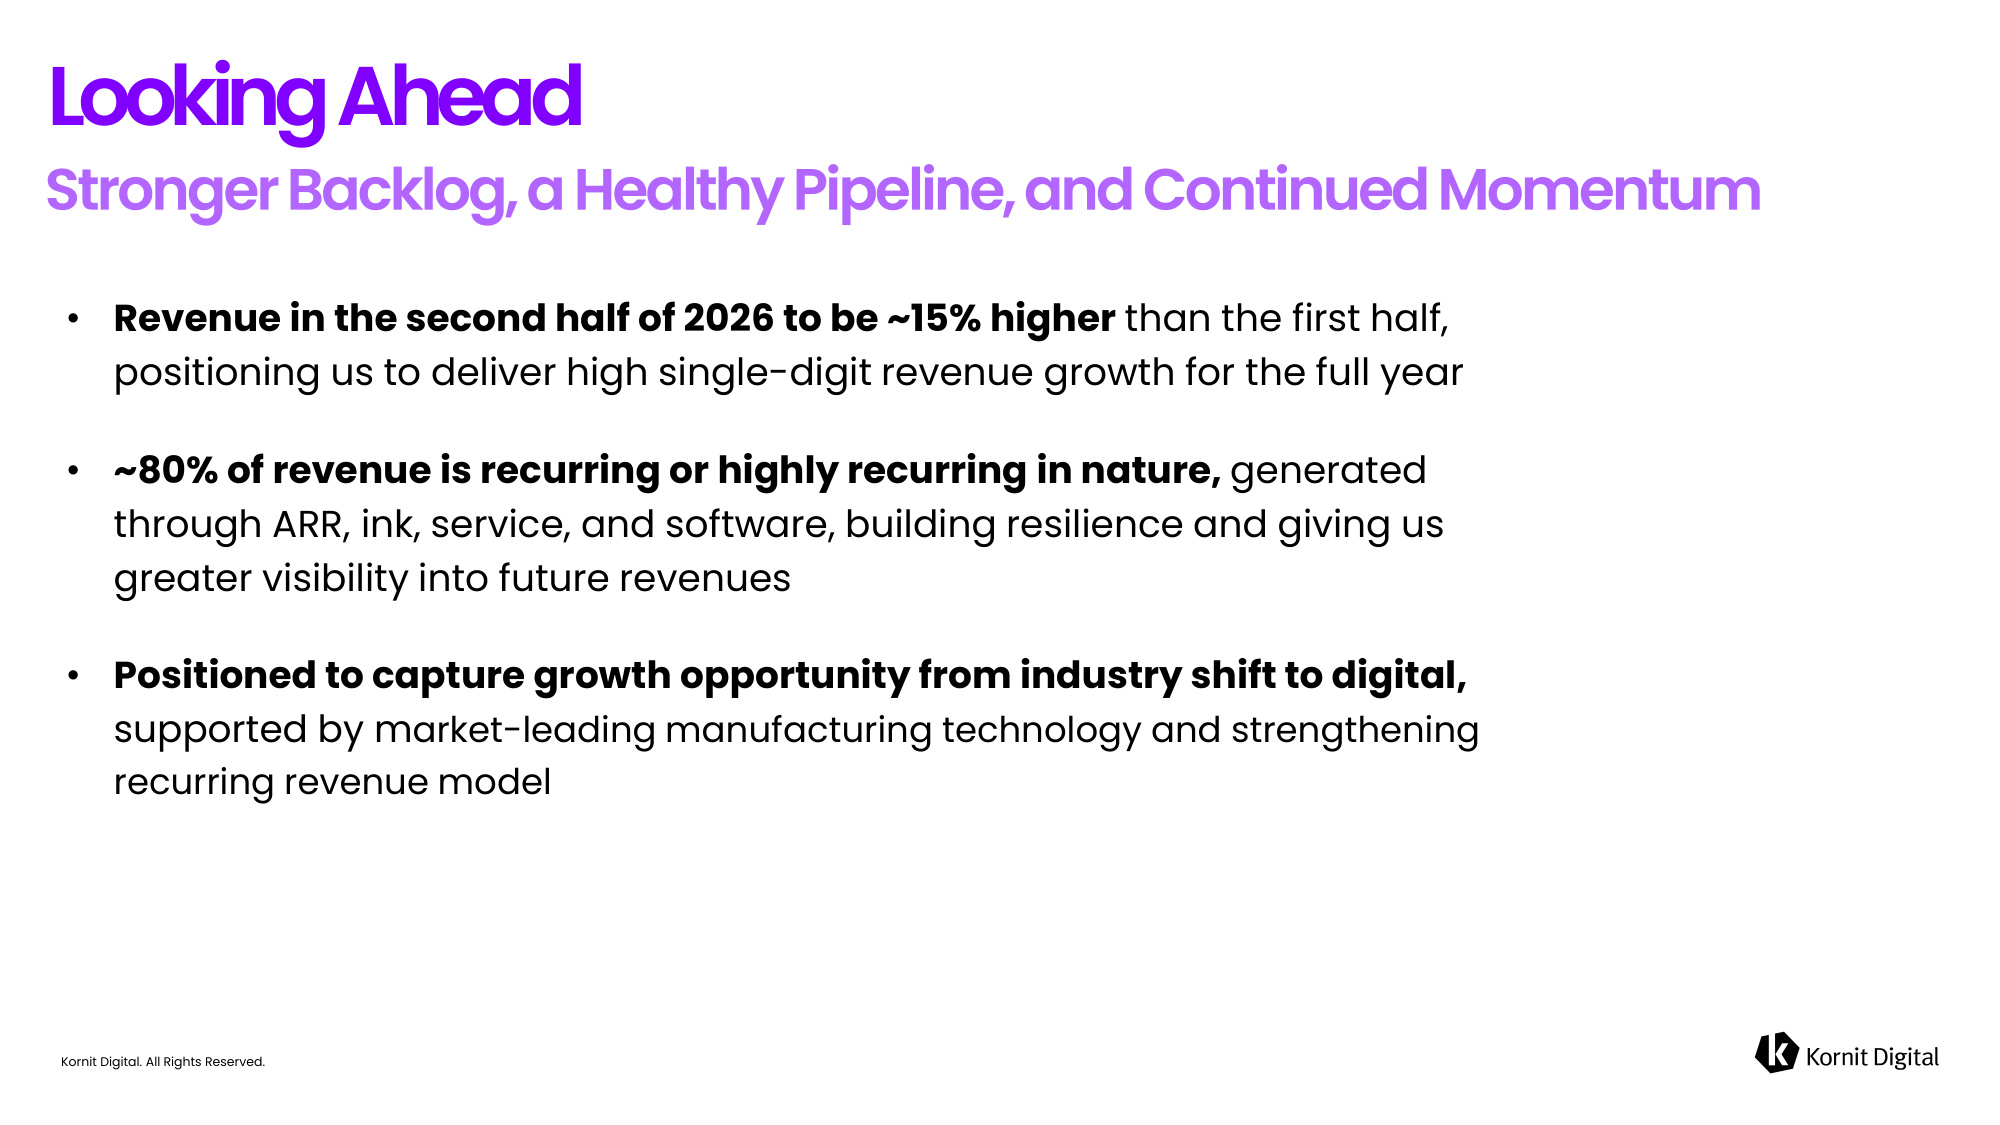
Kornit Digital. All Rights Reserved. Looking Ahead • Revenue in the second half of 2026 to be ~15% higher than the first half, positioning us to deliver high single-digit revenue growth for the full year • ~80% of revenue is recurring or highly recurring in nature, generated through ARR, ink, service, and software, building resilience and giving us greater visibility into future revenues • Positioned to capture growth opportunity from industry shift to digital, supported by market-leading manufacturing technology and strengthening recurring revenue model

Kornit Digital. All Rights Reserved. Financial Highlights
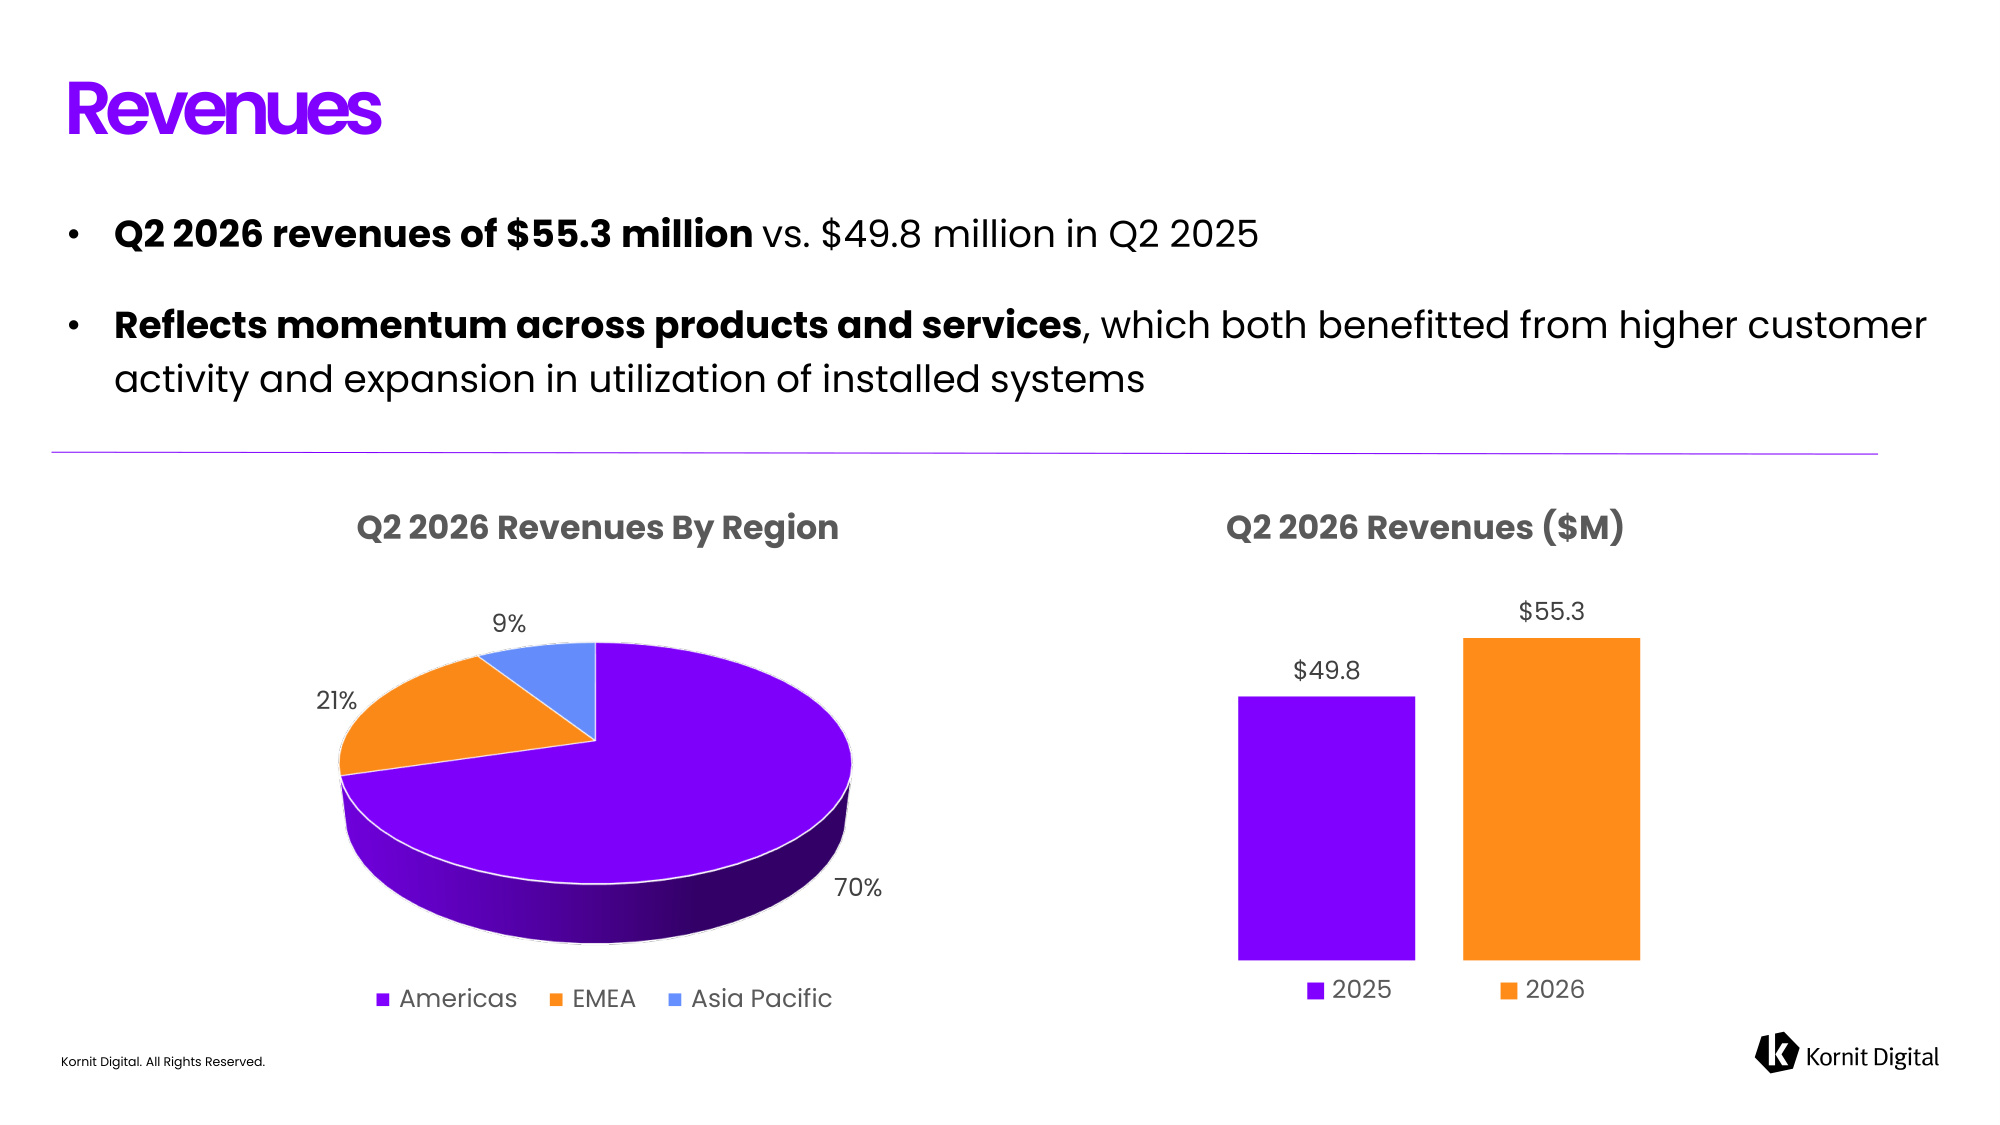
Kornit Digital. All Rights Reserved. • Q2 2026 revenues of $55.3 million vs. $49.8 million in Q2 2025 • Reflects momentum across products and services, which both benefitted from higher customer activity and expansion in utilization of installed systems Revenues 70% 21% 9% Q2 2026 Revenues By Region Americas EMEA Asia Pacific $49.8 $55.3 Q2 2026 Revenues ($M) 2025 2026
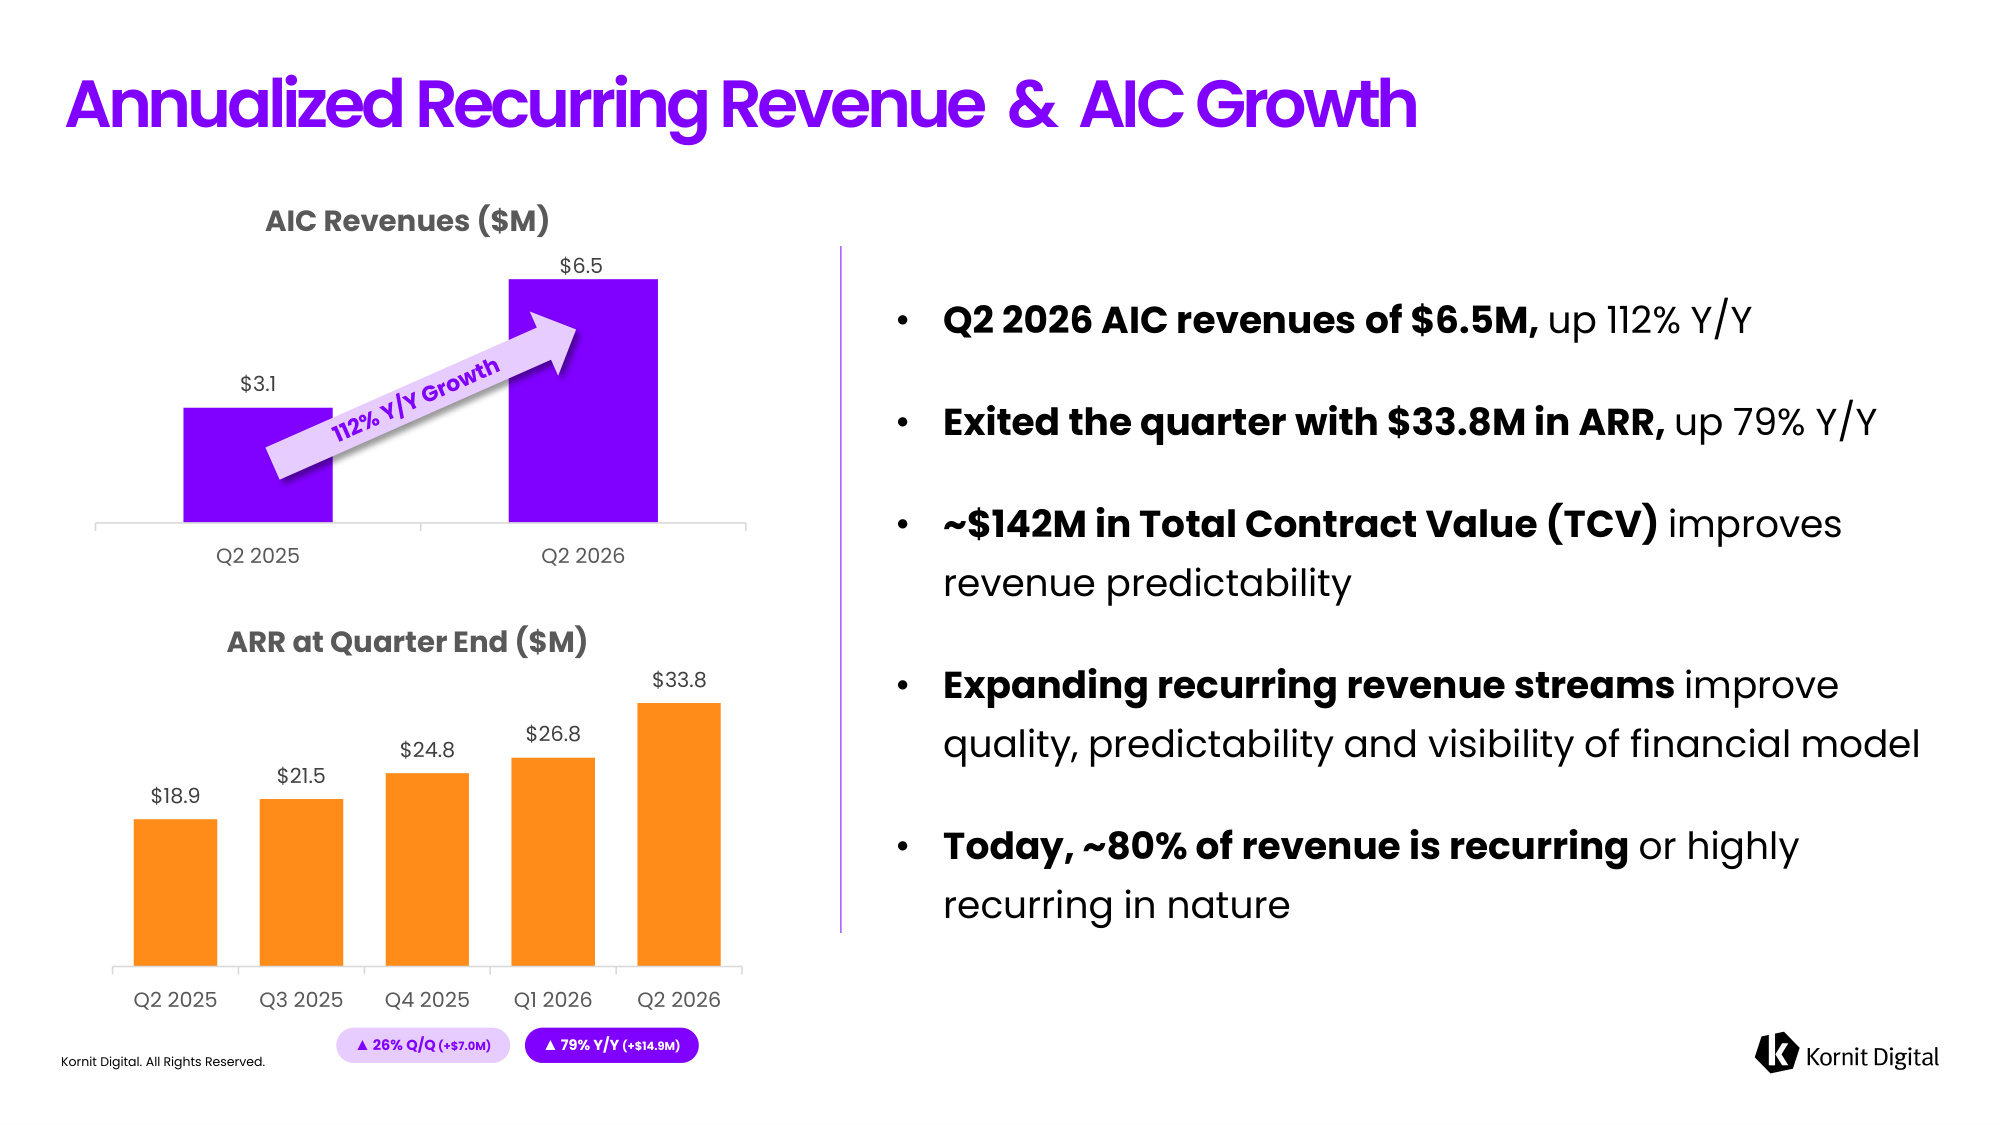
Kornit Digital. All Rights Reserved. • Q2 2026 AIC revenues of $6.5M, up 112% Y/Y • Exited the quarter with $33.8M in ARR, up 79% Y/Y • ~$142M in Total Contract Value (TCV) improves revenue predictability • Expanding recurring revenue streams improve quality, predictability and visibility of financial model • Today, ~80% of revenue is recurring or highly recurring in nature Annualized Recurring Revenue & AIC Growth $18.9 $21.5 $24.8 $26.8 $33.8 Q2 2025 Q3 2025 Q4 2025 Q1 2026 Q2 2026 $3.1 $6.5 Q2 2025 Q2 2026 ARR at Quarter End ($M) AIC Revenues ($M) ▲ 26% Q/Q (+$7.0M) ▲ 79% Y/Y (+$14.9M)
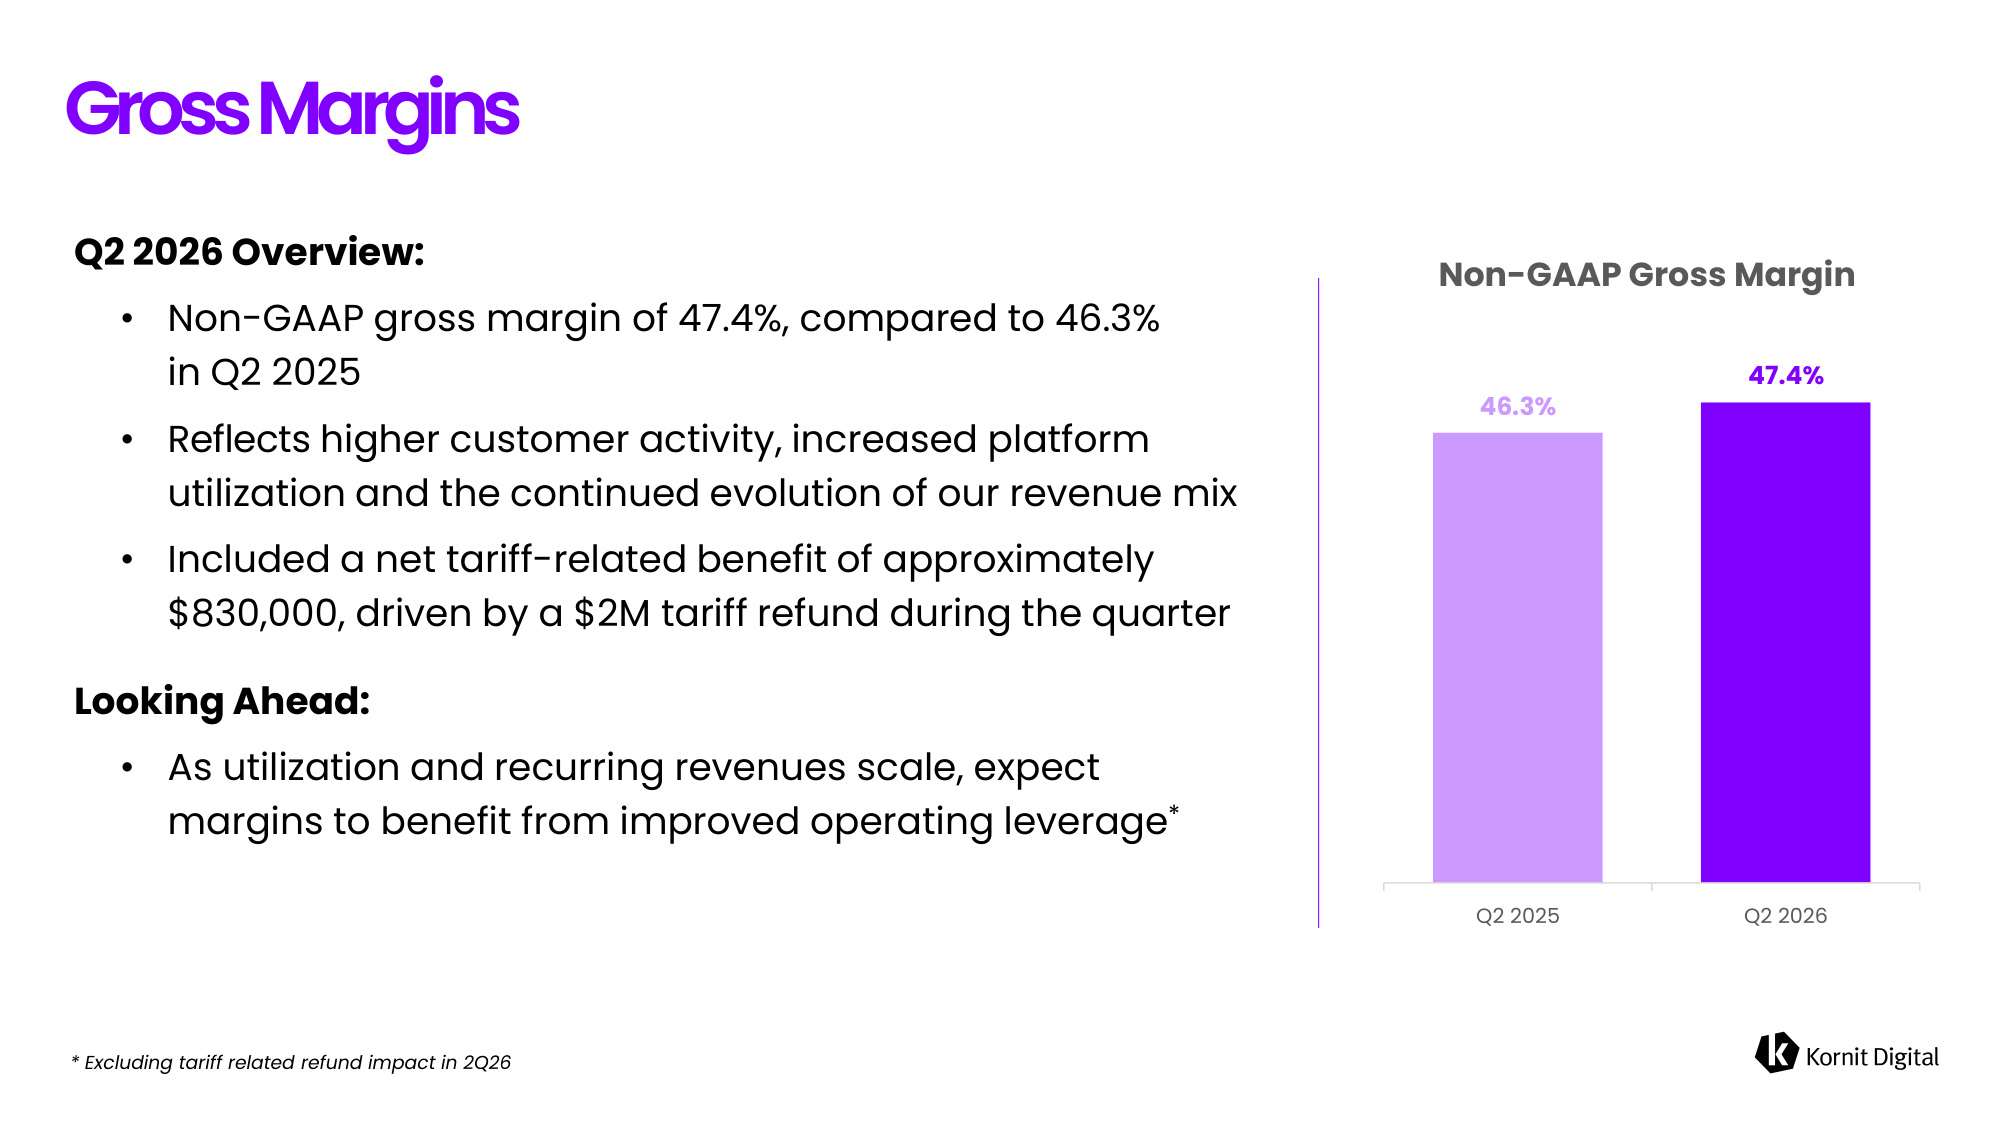
Kornit Digital. All Rights Reserved. Q2 2026 Overview: • Non-GAAP gross margin of 47.4%, compared to 46.3% in Q2 2025 • Reflects higher customer activity, increased platform utilization and the continued evolution of our revenue mix • Included a net tariff-related benefit of approximately $830,000, driven by a $2M tariff refund during the quarter Looking Ahead: • As utilization and recurring revenues scale, expect margins to benefit from improved operating leverage* Gross Margins 46.3% 47.4% Q2 2025 Q2 2026 Non-GAAP Gross Margin * Excluding tariff related refund impact in 2Q26
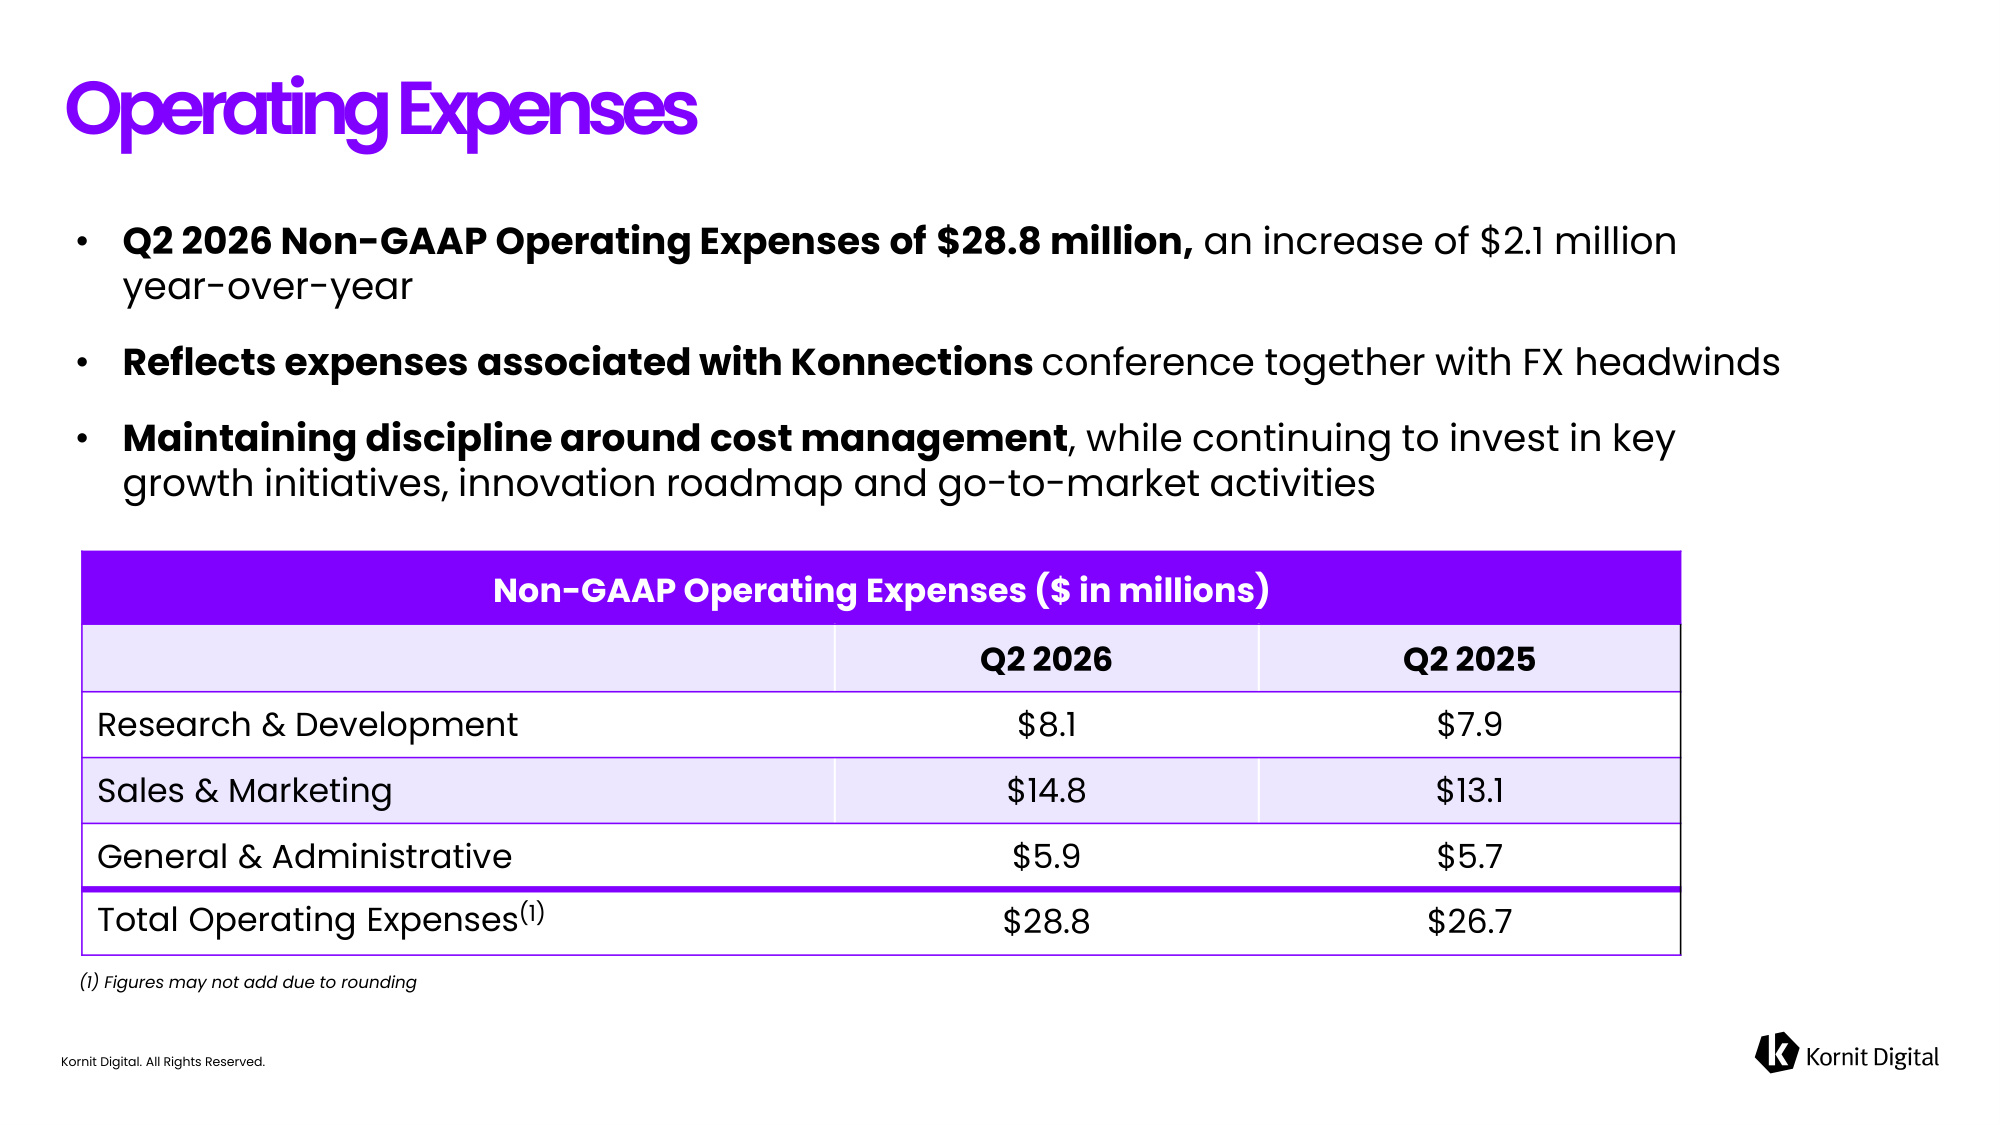
Kornit Digital. All Rights Reserved. • Q2 2026 Non-GAAP Operating Expenses of $28.8 million, an increase of $2.1 million year-over-year • Reflects expenses associated with Konnections conference together with FX headwinds • Maintaining discipline around cost management, while continuing to invest in key growth initiatives, innovation roadmap and go-to-market activities Operating Expenses (1) Figures may not add due to rounding Non-GAAP Operating Expenses ($ in millions) Q2 2026 Q2 2025 Research & Development $8.1 $7.9 Sales & Marketing $14.8 $13.1 General & Administrative $5.9 $5.7 Total Operating Expenses(1) $28.8 $26.7
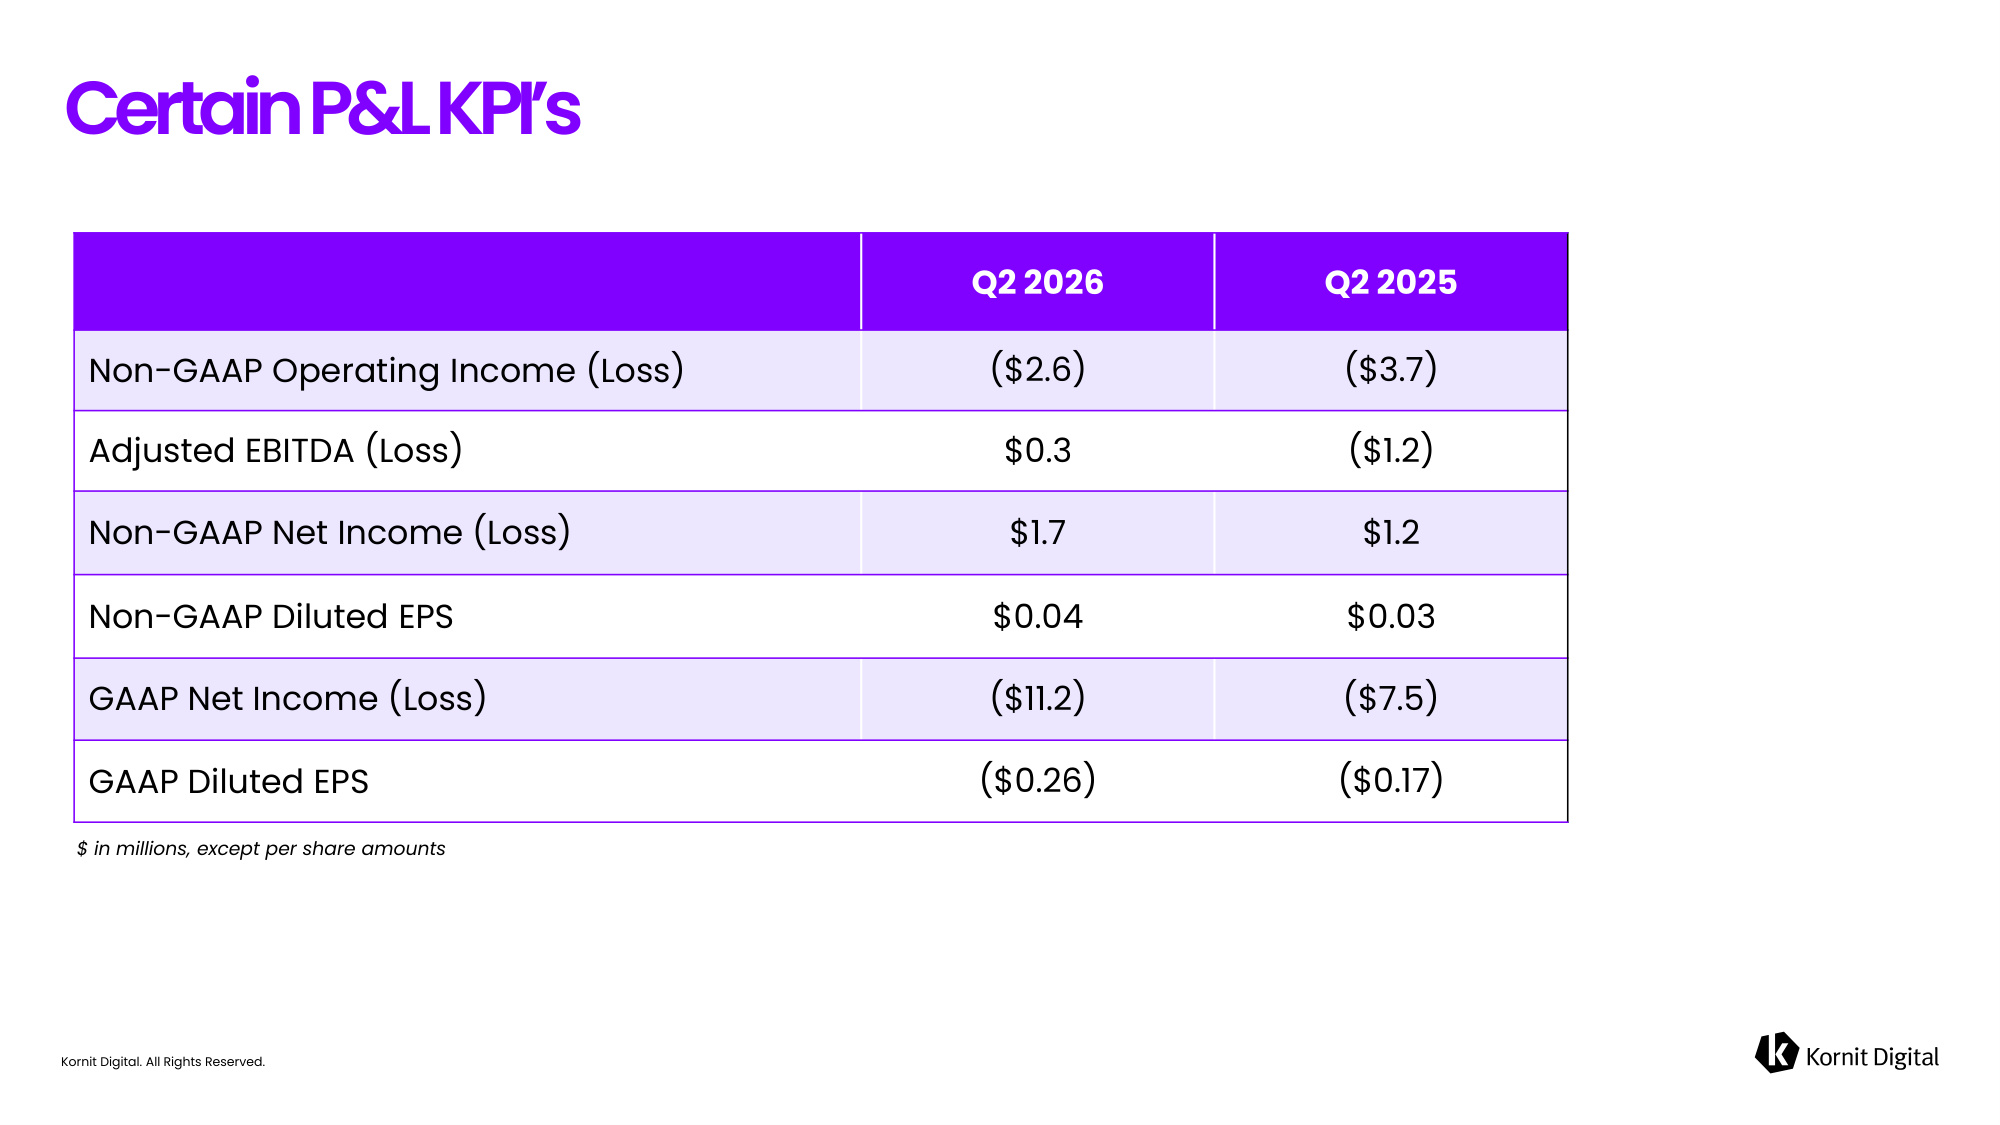
Kornit Digital. All Rights Reserved. Certain P&L KPI's $ in millions, except per share amounts Q2 2026 Q2 2025 Non-GAAP Operating Income (Loss) ($2.6) ($3.7) Adjusted EBITDA (Loss) $0.3 ($1.2) Non-GAAP Net Income (Loss) $1.7 $1.2 Non-GAAP Diluted EPS $0.04 $0.03 GAAP Net Income (Loss) ($11.2) ($7.5) GAAP Diluted EPS ($0.26) ($0.17)
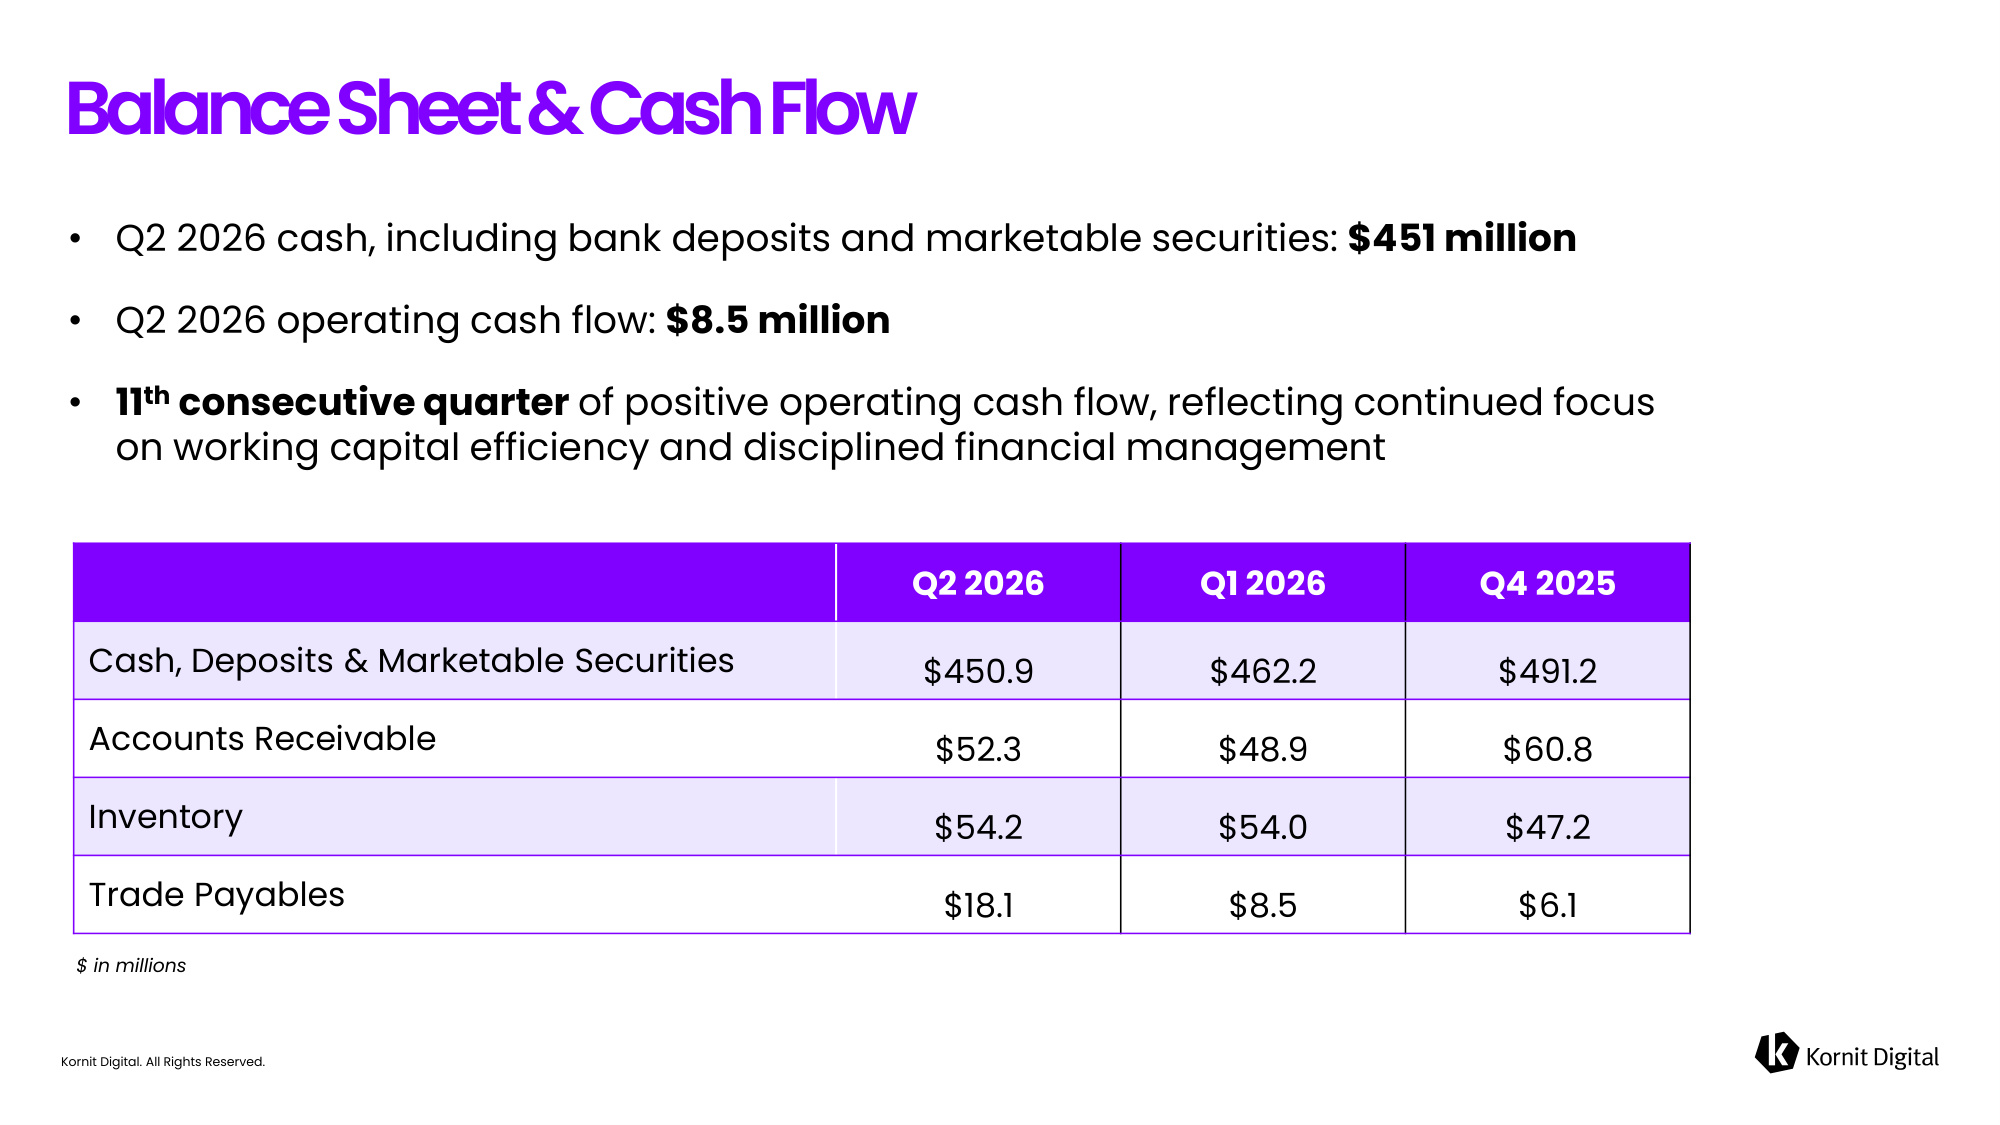
Kornit Digital. All Rights Reserved. • Q2 2026 cash, including bank deposits and marketable securities: $451 million • Q2 2026 operating cash flow: $8.5 million • 11th consecutive quarter of positive operating cash flow, reflecting continued focus on working capital efficiency and disciplined financial management Balance Sheet & Cash Flow $ in millions Q2 2026 Q1 2026 Q4 2025 Cash, Deposits & Marketable Securities $450.9 $462.2 $491.2 Accounts Receivable $52.3 $48.9 $60.8 Inventory $54.2 $54.0 $47.2 Trade Payables $18.1 $8.5 $6.1
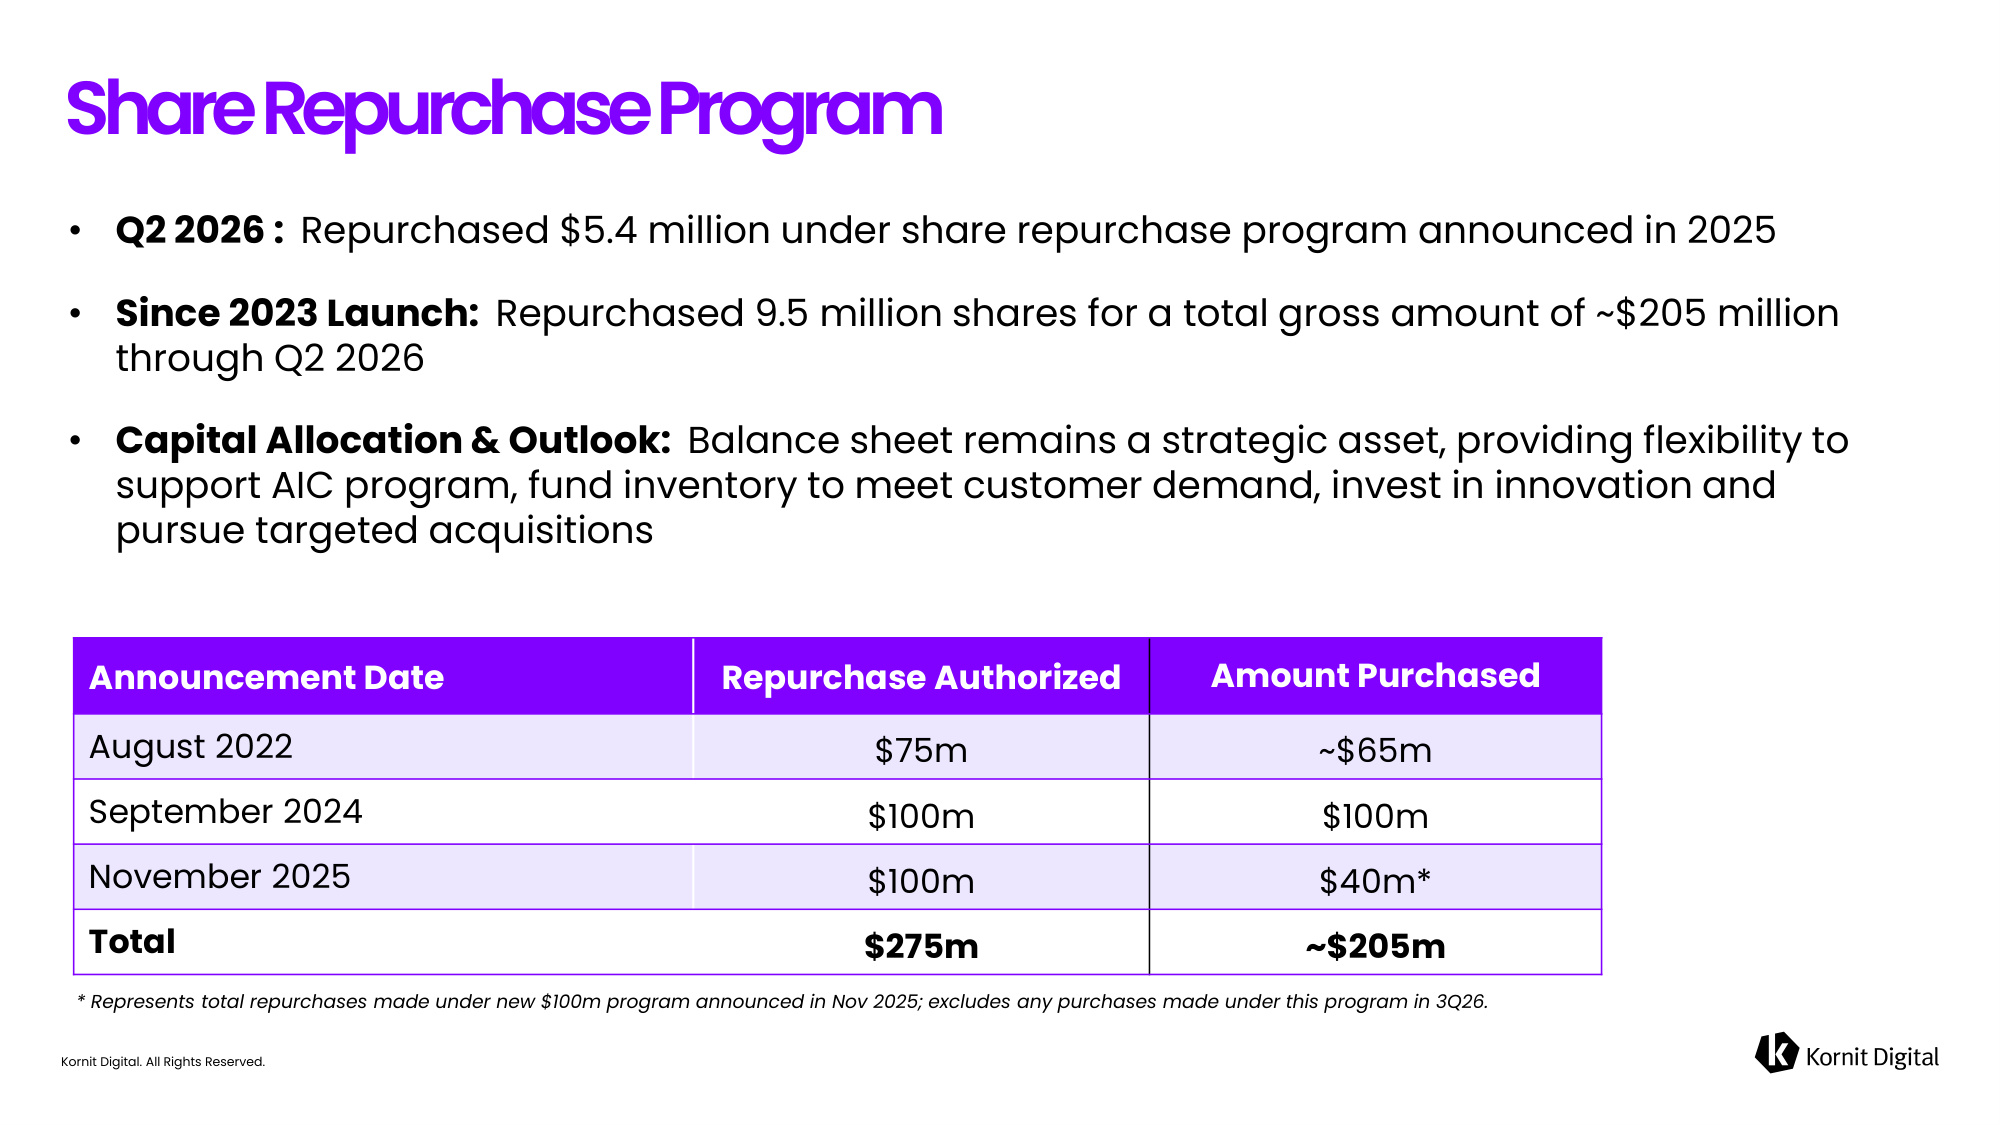
Kornit Digital. All Rights Reserved. • Q2 2026 : Repurchased $5.4 million under share repurchase program announced in 2025 • Since 2023 Launch: Repurchased 9.5 million shares for a total gross amount of ~$205 million through Q2 2026 • Capital Allocation & Outlook: Balance sheet remains a strategic asset, providing flexibility to support AIC program, fund inventory to meet customer demand, invest in innovation and pursue targeted acquisitions Share Repurchase Program * Represents total repurchases made under new $100m program announced in Nov 2025; excludes any purchases made under this program in 3Q26. Announcement Date Repurchase Authorized Amount Purchased August 2022 $75m ~$65m September 2024 $100m $100m November 2025 $100m $40m* Total $275m ~$205m
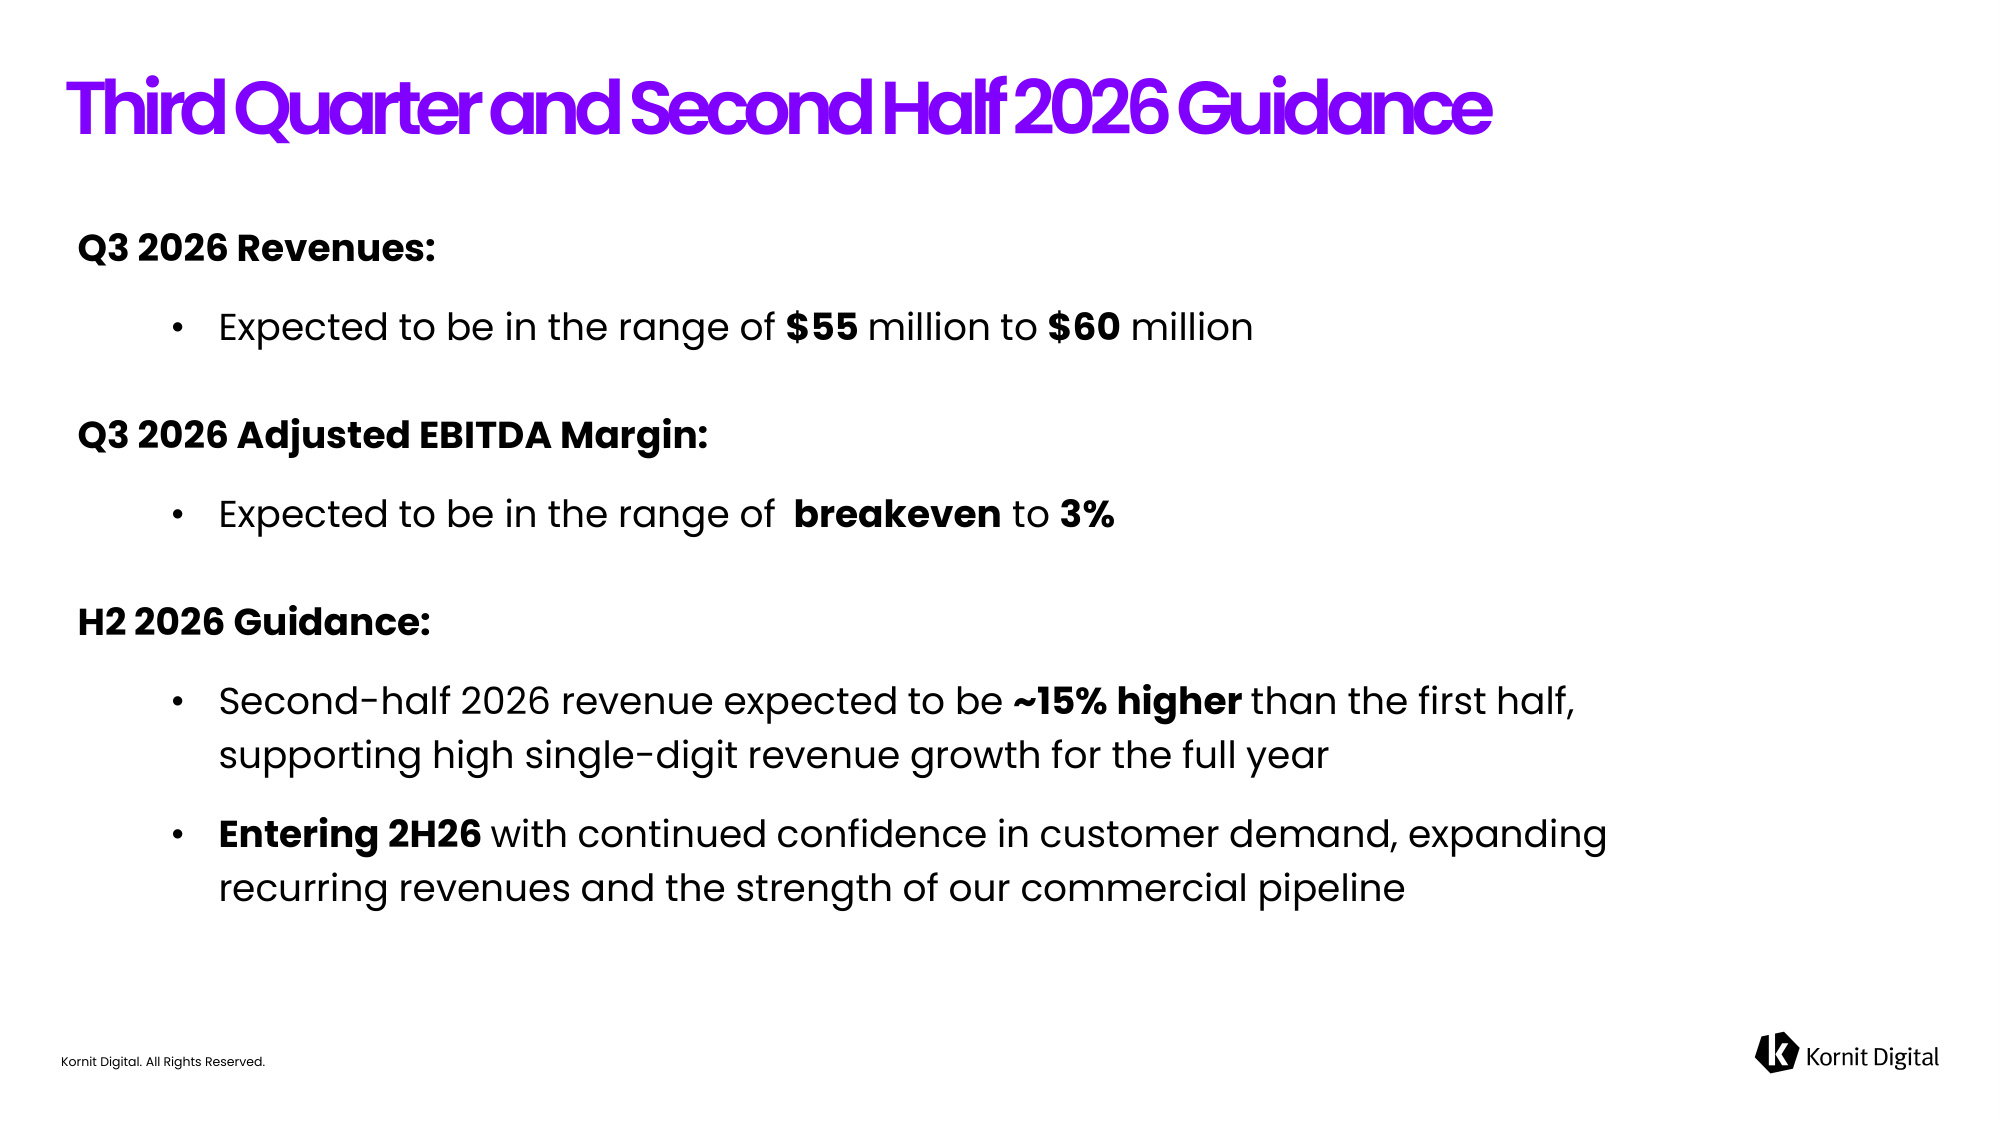
Kornit Digital. All Rights Reserved. Q3 2026 Revenues: • Expected to be in the range of $55 million to $60 million Q3 2026 Adjusted EBITDA Margin: • Expected to be in the range of breakeven to 3% H2 2026 Guidance: • Second-half 2026 revenue expected to be ~15% higher than the first half, supporting high single-digit revenue growth for the full year • Entering 2H26 with continued confidence in customer demand, expanding recurring revenues and the strength of our commercial pipeline Third Quarter and Second Half 2026 Guidance
Kornit Digital. All Rights Reserved.
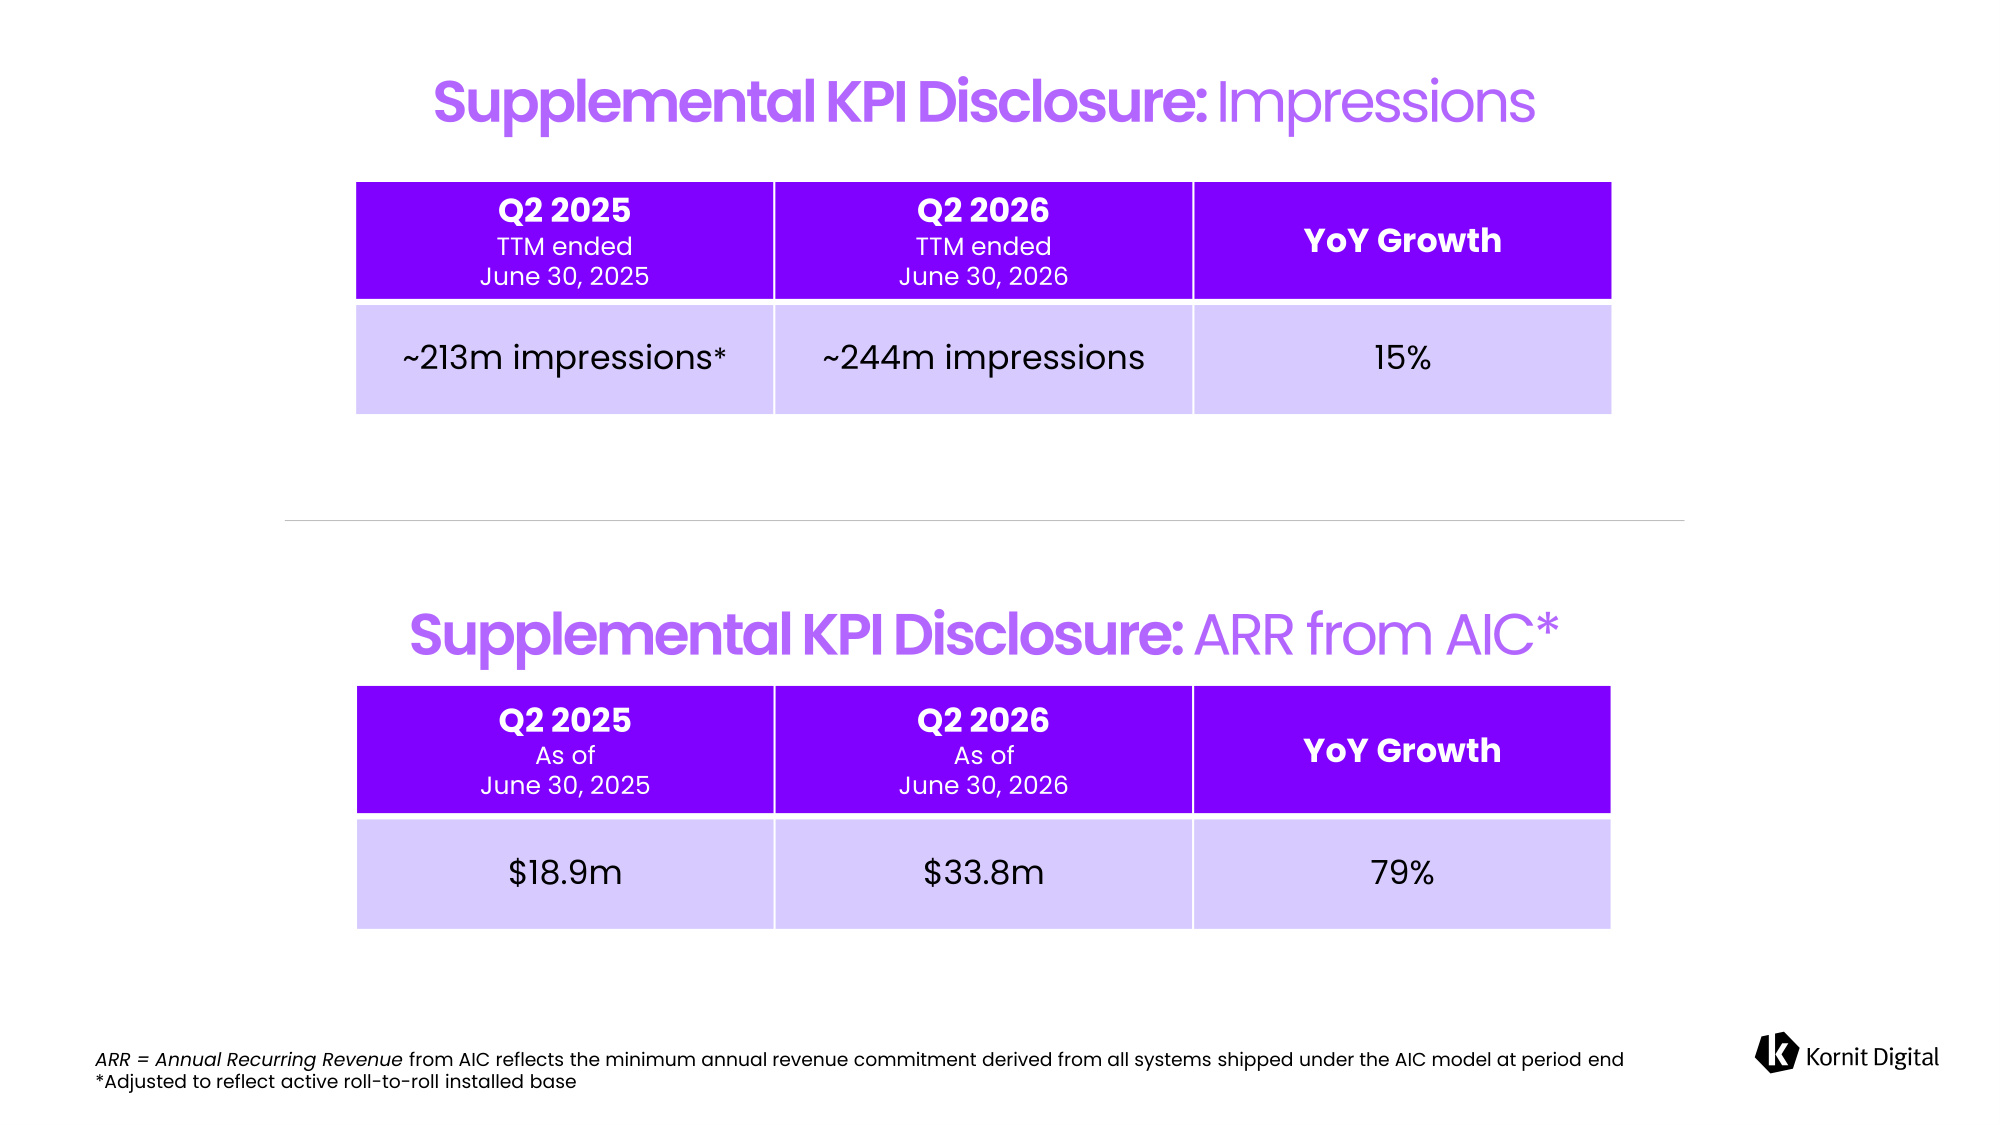
Kornit Digital. All Rights Reserved. Q2 2025 TTM ended June 30, 2025 Q2 2026 TTM ended June 30, 2026 YoY Growth ~213m impressions ~244m impressions 15% Q2 2025 As of June 30, 2025 Q2 2026 As of June 30, 2026 YoY Growth $18.9m $33.8m 79% ARR = Annual Recurring Revenue from AIC reflects the minimum annual revenue commitment derived from all systems shipped under the AIC model at period end

Kornit Digital. All Rights Reserved. Thank You!