
UNITED STATES
SECURITIES AND EXCHANGE COMMISSION
Washington, D.C. 20549
FORM 6-K
REPORT OF FOREIGN PRIVATE ISSUER
PURSUANT TO RULE 13a-16 OR 15d-16 OF
THE SECURITIES EXCHANGE ACT OF 1934
For the month of August 2025
Commission File Number 001-36903
KORNIT DIGITAL LTD.
(Translation of Registrant’s name into English)
12 Ha’Amal Street
Park Afek
Rosh Ha’Ayin 4824096 Israel
(Address of Principal Executive Office)
Indicate by check mark whether the registrant files or will file annual reports under cover of Form 20-F or Form 40-F.
Form 20-F ☒ Form 40-F ☐
CONTENTS
Results of Operations and Financial Condition- Quarter Ended June 30, 2025
On August 6, 2025, Kornit Digital Ltd. (“Kornit”) issued a press release entitled “Kornit Digital Reports Second Quarter 2025 Results,” in which Kornit reported its results of operations for the second quarter ended June 30, 2025. A copy of that press release is furnished as Exhibit 99.1 hereto.
Kornit is holding a conference call on August 6, 2025 to discuss its results for the quarter ended June 30, 2025, and, in connection with that call, will make available to its investors a slide presentation to provide additional information regarding its business and its financial results. That slide presentation is attached as Exhibit 99.2 to this Report of Foreign Private Issuer on Form 6-K (this “Form 6-K”) and is incorporated herein by reference.
Exhibits
Incorporation by Reference
The U.S. GAAP financial information contained in the (i) consolidated balance sheets, (ii) consolidated statements of operations and (iii) consolidated statements of cash flows included in the press release attached as Exhibit 99.1 to this Report of Foreign Private Issuer on Form 6-K is hereby incorporated by reference into Kornit’s Registration Statements on Form S-8 (File No.’s 333-203970, 333-214015, 333-217039, 333-223794, 333-230567, 333-237346,333-254749, 333-263975 and 333-286158).
1
SIGNATURES
Pursuant to the requirements of the Securities Exchange Act of 1934, the registrant has duly caused this report to be signed on its behalf by the undersigned, thereunto duly authorized.
| KORNIT DIGITAL LTD. | ||
| Date: August 6, 2025 | By: | /s/ Lauri Hanover |
| Name: | Lauri Hanover | |
| Title: | Chief Financial Officer | |
2
Exhibit 99.1
Investor Contact:
Jared Maymon
Global Head of Investor Relations & Strategic Finance
Jared.Maymon@Kornit.com

Kornit Digital Reports Second Quarter 2025 Results
| ● | Second quarter revenues of $49.8 million, in line with previous guidance |
| ● | Second quarter GAAP net loss of $7.5 million; non-GAAP net income of $1.2 million |
| ● | Continued to generate cash from operations |
| ● | Reported annual recurring revenue from AIC contracts of $18.9 million, reflecting continued adoption of this new model, particularly from screen-printing customers. |
Rosh-Ha`Ayin, Israel – August 6, 2025 – Kornit Digital Ltd. (“Kornit” or the “Company”) (Nasdaq: KRNT), a global leader in sustainable, on-demand, digital fashion and textile production technologies, today reported results for the second quarter ended June 30, 2025.
“We delivered second quarter results within our guidance range in a challenging market environment, reflecting ongoing progress in transforming our business toward recurring revenue and long-term growth. While consumables revenue came in softer due to inventory adjustments among certain customers, system sales and AIC adoption maintained momentum. We saw particularly positive traction from screen-printing customers embracing digital for the first time, for a variety of run lengths, as well as capacity expansions from customized design customers,” said Ronen Samuel, Kornit’s Chief Executive Officer.
Mr. Samuel continued, “Despite a more modest outlook for the second half, we remain focused on the execution of our strategy. Our priorities are clear: scaling adoption of the Apollo and AIC, growing the number of screen-printing customers we serve, and maintaining both adjusted EBITDA profitability and operating cash flow generation. With disciplined execution and continued focus, we remain confident these efforts will lay the foundation for a more resilient, scalable, and profitable business.”
Second Quarter 2025 Results of Operations
| ● | Total revenue for the second quarter of 2025 was $49.8 million compared with $48.6 million in the prior year period. |
| ● | GAAP gross profit margin for the second quarter of 2025 was 41.7% compared with 45.8% in the prior year period. On a non-GAAP basis, gross profit margin was 46.3% compared with 48.6% in the prior year period. |
| ● | GAAP operating expenses for the second quarter of 2025 were $31.6 million compared with $33.0 million in the prior year period. On a non-GAAP basis, operating expenses decreased by 4.4% to $26.7 million compared with the prior year period. |
| ● | GAAP net loss for the second quarter of 2025 was $7.5 million, or ($0.17) per basic share, compared with net loss of $4.9 million, or ($0.10) per basic share, for the second quarter of 2024. |
| ● | Non-GAAP net income for the second quarter of 2025 was $1.2 million, or $0.03 per share, compared with non-GAAP net income of $1.1 million, or $0.02 per share, for the second quarter of 2024. |
| ● | Adjusted EBITDA loss for the second quarter of 2025 was $1.2 million compared with adjusted EBITDA loss of $1.6 million for the second quarter of 2024. Adjusted EBITDA margin for the second quarter of 2025 was negative 2.3% compared with negative 3.4% for the second quarter of 2024. |
Third Quarter 2025 Guidance
For the Third quarter of 2025, the Company expects revenues to be in the range of $49 million to $55 million and adjusted EBITDA margin between negative 3% and 3%.
Second Quarter Earnings Conference Call Information
The Company will host a conference call today at 8:30 a.m. ET, or 3:30 p.m. Israel time, to discuss the results, followed by a question-and-answer session with the investor community.
A live webcast of the call can be accessed at ir.kornit.com. To access the call, participants may dial toll-free at 1-800-579-2543 or 1-785-424-1789. The Israel Toll free number is 180-925-6145. The conference ID required to join the call is KORNIT.
To listen to a replay of the conference call, dial toll-free 1-844-512-2921 or 1-412-317-6671 and enter access ID 11159631. The telephonic replay will be available approximately three hours after the completion of the live call until 11:59 pm ET on August 20, 2025. The call will also be available for replay via the webcast link on Kornit’s Investor Relations website.
About Kornit Digital
Kornit Digital (NASDAQ: KRNT) is a worldwide market leader in sustainable, on-demand, digital fashion, and textile production technologies. The company offers end-to-end solutions including digital printing systems, inks, consumables, software, and fulfillment services through its global fulfillment network. Headquartered in Israel with offices in the USA, Europe, and Asia Pacific, Kornit Digital serves customers in more than 100 countries and states worldwide. To learn more about how Kornit Digital is boldly transforming the world of fashion and textiles, visit www.kornit.com.
2
Forward Looking Statements
Certain statements in this press release are “forward-looking statements” within the meaning of the Private Securities Litigation Reform Act of 1995 and other U.S. securities laws. Forward-looking statements are characterized by the use of forward-looking terminology such as “will,” “expects,” “anticipates,” “continue,” “believes,” “should,” “intended,” “guidance,” “preliminary,” “future,” “planned,” or other words. These forward-looking statements include, but are not limited to, statements relating to the Company’s objectives, plans and strategies, statements of preliminary or projected results of operations or of financial condition and all statements that address activities, events, or developments that the Company intends, expects, projects, believes or anticipates will or may occur in the future. Forward-looking statements are not guarantees of future performance and are subject to risks and uncertainties. The Company has based these forward-looking statements on assumptions and assessments made by its management in light of their experience and their perception of historical trends, current conditions, expected future developments and other factors they believe to be appropriate. Important factors that could cause actual results, developments and business decisions to differ materially from those anticipated in these forward-looking statements include, among other things: the duration and severity of adverse macro-economic headwinds that were caused by inflationary pressures and higher interest rates, which have impacted, and may continue to impact, in an adverse manner, the Company’s operations, financial position and cash flows, in part due to the adverse impact on the Company’s customers and suppliers; the Company’s degree of success in developing, introducing and selling new or improved products and product enhancements including specifically the Company’s Poly Pro and Presto products, and the Company’s Apollo direct-to-garment platform; the extent of the Company’s ability to consummate sales to large accounts with multi-system delivery plans; the degree of the Company’s ability to fill orders for its systems and consumables; the extent of the Company’s ability to increase sales of its systems, ink and consumables; the extent of the Company’s ability to leverage its global infrastructure build-out; the development of the market for digital textile printing; the availability of alternative ink; competition; sales concentration; changes to the Company’s relationships with suppliers; the extent of the Company’s success in marketing; and those additional factors referred to under “Risk Factors” in Item 3.D of the Company’s Annual Report on Form 20-F for the year ended December 31, 2024, filed with the SEC on March 28, 2025. Any forward-looking statements in this press release are made as of the date hereof, whether as a result of new information, future events or otherwise, except as required by law.
Non-GAAP Discussion Disclosure
The Company presents certain non-GAAP financial measures, in this press release and in the accompanying conference call to discuss the Company’s quarterly results. These non-GAAP financial measures reflect adjustments to corresponding GAAP financial measures in order to exclude the impact of the following: share-based compensation expenses; amortization of intangible assets; restructuring expenses; foreign exchange differences associated with ASC 842; and non-cash deferred tax income.
The Company defines “Adjusted EBITDA” as non-GAAP operating income (loss), which reflects the adjustments described in the preceding paragraph, as further adjusted to exclude depreciation expense.
The purpose of the foregoing non-GAAP financial measures is to convey the Company’s performance exclusive of non-cash charges and other items that are considered by management to be outside of the Company’s core operating results. These non-GAAP measures are among the primary factors management uses in planning for and forecasting future periods. Furthermore, the non-GAAP measures are regularly used internally to understand, manage, and evaluate the Company’s business and make operating decisions, and the Company believes that they are useful to investors as a consistent and comparable measure of the ongoing performance of the Company’s business. The Company’s non-GAAP financial measures are not meant to be considered in isolation or as a substitute for comparable GAAP measures and should be read only in conjunction with the Company’s consolidated financial statements prepared in accordance with GAAP. Additionally, these non-GAAP financial measures may differ materially from the non-GAAP financial measures used by other companies.
The reconciliation tables included below present a reconciliation of our non-GAAP financial measures to the most directly comparable GAAP financial measures.
3
KORNIT DIGITAL LTD.
AND ITS SUBSIDIARIES
CONSOLIDATED BALANCE SHEETS
(U.S. dollars in thousands)
| June 30, | December 31, | |||||||
| 2025 | 2024 | |||||||
| (Unaudited) | (Audited) | |||||||
| ASSETS | ||||||||
| CURRENT ASSETS: | ||||||||
| Cash and cash equivalents | $ | 25,418 | $ | 35,003 | ||||
| Short-term bank deposit | 306,437 | 205,934 | ||||||
| Marketable securities | 99,757 | 222,937 | ||||||
| Trade receivables, net | 64,457 | 65,459 | ||||||
| Inventory | 50,023 | 60,342 | ||||||
| Other accounts receivable and prepaid expenses | 28,586 | 25,714 | ||||||
| Total current assets | 574,678 | 615,389 | ||||||
| LONG-TERM ASSETS: | ||||||||
| Marketable securities | 56,991 | 48,086 | ||||||
| Deposits and other long-term assets | 14,089 | 10,542 | ||||||
| Severance pay fund | 344 | 306 | ||||||
| Property,plant and equipment, net | 67,296 | 59,222 | ||||||
| Operating lease right-of-use assets | 18,443 | 19,054 | ||||||
| Intangible assets, net | 4,955 | 5,721 | ||||||
| Goodwill | 29,164 | 29,164 | ||||||
| Total long-term assets | 191,282 | 172,095 | ||||||
| Total assets | 765,960 | 787,484 | ||||||
| LIABILITIES AND SHAREHOLDERS' EQUITY | ||||||||
| CURRENT LIABILITIES: | ||||||||
| Trade payables | 10,032 | 9,019 | ||||||
| Employees and payroll accruals | 13,386 | 13,101 | ||||||
| Deferred revenues and advances from customers | 1,566 | 2,339 | ||||||
| Operating lease liabilities | 3,670 | 3,311 | ||||||
| Other payables and accrued expenses | 16,434 | 16,561 | ||||||
| Total current liabilities | 45,088 | 44,331 | ||||||
| LONG-TERM LIABILITIES: | ||||||||
| Accrued severance pay | 472 | 1,051 | ||||||
| Operating lease liabilities | 15,525 | 15,065 | ||||||
| Other long-term liabilities | 126 | 138 | ||||||
| Total long-term liabilities | 16,123 | 16,254 | ||||||
| SHAREHOLDERS' EQUITY | 704,749 | 726,899 | ||||||
| Total liabilities and shareholders' equity | $ | 765,960 | $ | 787,484 | ||||
4
KORNIT DIGITAL LTD.
AND ITS SUBSIDIARIES
CONSOLIDATED STATEMENTS OF OPERATIONS
(U.S. dollars in thousands, except share and per share data)
| Three Months Ended | Six Months Ended | |||||||||||||||
| June 30, | June 30, | |||||||||||||||
| 2025 | 2024 | 2025 | 2024 | |||||||||||||
| (Unaudited) | (Unaudited) | |||||||||||||||
| Revenues | ||||||||||||||||
| Products | $ | 38,413 | $ | 34,366 | $ | 72,278 | $ | 63,379 | ||||||||
| Services | 11,341 | 14,255 | 23,933 | 29,018 | ||||||||||||
| Total revenues | 49,754 | 48,621 | 96,211 | 92,397 | ||||||||||||
| Cost of revenues | ||||||||||||||||
| Products | 17,967 | 13,271 | 33,580 | 28,962 | ||||||||||||
| Services | 11,043 | 13,066 | 22,087 | 27,012 | ||||||||||||
| Total cost of revenues | 29,010 | 26,337 | 55,667 | 55,974 | ||||||||||||
| Gross profit | 20,744 | 22,284 | 40,544 | 36,423 | ||||||||||||
| Operating expenses: | ||||||||||||||||
| Research and development, net | 9,143 | 10,472 | 18,421 | 21,824 | ||||||||||||
| Sales and marketing | 14,993 | 14,976 | 29,942 | 28,772 | ||||||||||||
| General and administrative | 7,474 | 7,532 | 15,118 | 14,809 | ||||||||||||
| Total operating expenses | 31,610 | 32,980 | 63,481 | 65,405 | ||||||||||||
| Operating loss | (10,866 | ) | (10,696 | ) | (22,937 | ) | (28,982 | ) | ||||||||
| Financial income, net | 3,465 | 6,435 | 10,848 | 11,781 | ||||||||||||
| Loss before taxes on income | (7,401 | ) | (4,261 | ) | (12,089 | ) | (17,201 | ) | ||||||||
| Taxes on income | 117 | 648 | 488 | 907 | ||||||||||||
| Net loss | $ | (7,518 | ) | $ | (4,909 | ) | $ | (12,577 | ) | $ | (18,108 | ) | ||||
| Basic loss per share | $ | (0.17 | ) | $ | (0.10 | ) | $ | (0.28 | ) | $ | (0.38 | ) | ||||
| Weighted average number of shares used in computing basic net loss per share | 45,164,493 | 47,535,212 | 45,482,748 | 47,573,334 | ||||||||||||
| Diluted loss per share | $ | (0.17 | ) | $ | (0.10 | ) | $ | (0.28 | ) | $ | (0.38 | ) | ||||
| Weighted average number of shares used in computing diluted net loss per share | 45,164,493 | 47,535,212 | 45,482,748 | 47,573,334 | ||||||||||||
5
KORNIT DIGITAL LTD.
AND ITS SUBSIDIARIES
RECONCILIATION OF GAAP TO NON-GAAP CONSOLIDATED STATEMENTS OF OPERATIONS
(U.S. dollars in thousands, except share and per share data)
| Three Months Ended | Six Months Ended | |||||||||||||||
| June 30, | June 30, | |||||||||||||||
| 2025 | 2024 | 2025 | 2024 | |||||||||||||
| (Unaudited) | (Unaudited) | |||||||||||||||
| Revenues | $ | 49,754 | $ | 48,621 | $ | 96,211 | $ | 92,397 | ||||||||
| GAAP cost of revenues | $ | 29,010 | $ | 26,337 | $ | 55,667 | $ | 55,974 | ||||||||
| Cost of product recorded for share-based compensation (1) | (542 | ) | (490 | ) | (1,061 | ) | (992 | ) | ||||||||
| Cost of service recorded for share-based compensation (1) | (404 | ) | (453 | ) | (799 | ) | (872 | ) | ||||||||
| Intangible assets amortization on cost of product (2) | (150 | ) | (264 | ) | (298 | ) | (529 | ) | ||||||||
| Intangible assets amortization on cost of service (2) | (160 | ) | (160 | ) | (320 | ) | (320 | ) | ||||||||
| Restructuring expenses (3) | (1,026 | ) | - | (1,026 | ) | (914 | ) | |||||||||
| Non-GAAP cost of revenues | $ | 26,728 | $ | 24,970 | $ | 52,163 | $ | 52,347 | ||||||||
| GAAP gross profit | $ | 20,744 | $ | 22,284 | $ | 40,544 | $ | 36,423 | ||||||||
| Gross profit adjustments | 2,282 | 1,367 | 3,504 | 3,627 | ||||||||||||
| Non-GAAP gross profit | $ | 23,026 | $ | 23,651 | $ | 44,048 | $ | 40,050 | ||||||||
| GAAP operating expenses | $ | 31,610 | $ | 32,980 | $ | 63,481 | $ | 65,405 | ||||||||
| Share-based compensation (1) | (4,810 | ) | (4,926 | ) | (9,216 | ) | (9,453 | ) | ||||||||
| Intangible assets amortization (2) | (74 | ) | (87 | ) | (148 | ) | (175 | ) | ||||||||
| Restructuring expenses (3) | - | - | - | (757 | ) | |||||||||||
| Non-GAAP operating expenses | $ | 26,726 | $ | 27,967 | $ | 54,117 | $ | 55,020 | ||||||||
| GAAP Financial income, net | $ | 3,465 | $ | 6,435 | $ | 10,848 | $ | 11,781 | ||||||||
| Foreign exchange losses associated with ASC 842 | 1,578 | (269 | ) | 1,535 | 116 | |||||||||||
| Non-GAAP Financial income , net | $ | 5,043 | $ | 6,166 | $ | 12,383 | $ | 11,897 | ||||||||
| GAAP Taxes on income | $ | 117 | $ | 648 | $ | 488 | $ | 907 | ||||||||
| Non-cash deferred tax income | - | 86 | - | $ | 173 | |||||||||||
| Non-GAAP Taxes on income | $ | 117 | $ | 734 | $ | 488 | $ | 1,080 | ||||||||
| GAAP Net loss | $ | (7,518 | ) | $ | (4,909 | ) | $ | (12,577 | ) | $ | (18,108 | ) | ||||
| Share-based compensation (1) | 5,756 | 5,869 | 11,076 | 11,317 | ||||||||||||
| Intangible assets amortization (2) | 384 | 511 | 766 | 1,024 | ||||||||||||
| Restructuring expenses (3) | 1,026 | - | 1,026 | 1,671 | ||||||||||||
| Foreign exchange losses associated with ASC 842 | 1,578 | (269 | ) | 1,535 | 116 | |||||||||||
| Non-cash deferred tax income | - | (86 | ) | - | (173 | ) | ||||||||||
| Non-GAAP net income (loss) | $ | 1,226 | $ | 1,116 | $ | 1,826 | $ | (4,153 | ) | |||||||
| GAAP diluted loss per share | $ | (0.17 | ) | $ | (0.10 | ) | $ | (0.28 | ) | $ | (0.38 | ) | ||||
| Non-GAAP diluted income (loss) per share | $ | 0.03 | $ | 0.02 | $ | 0.04 | $ | (0.09 | ) | |||||||
| Weighted average number of shares | ||||||||||||||||
| Shares used in computing GAAP diluted net loss per share | 45,164,493 | 47,535,212 | 45,482,748 | 47,573,334 | ||||||||||||
| Shares used in computing Non-GAAP diluted net income (loss) per share | 45,508,379 | 49,898,775 | 45,931,988 | 47,573,334 | ||||||||||||
| (1) Share-based compensation | ||||||||||||||||
| Cost of product revenues | $ | 542 | $ | 490 | $ | 1,061 | $ | 992 | ||||||||
| Cost of service revenues | 404 | 453 | 799 | 872 | ||||||||||||
| Research and development | 1,213 | 1,376 | 2,415 | 2,671 | ||||||||||||
| Sales and marketing | 1,831 | 1,784 | 3,368 | 3,366 | ||||||||||||
| General and administrative | 1,766 | 1,766 | 3,433 | 3,416 | ||||||||||||
| $ | 5,756 | $ | 5,869 | $ | 11,076 | $ | 11,317 | |||||||||
| (2) Intangible assets amortization | ||||||||||||||||
| Cost of product revenues | $ | 150 | $ | 264 | $ | 298 | $ | 529 | ||||||||
| Cost of service revenues | 160 | 160 | 320 | 320 | ||||||||||||
| Sales and marketing | 74 | 87 | 148 | 175 | ||||||||||||
| $ | 384 | $ | 511 | $ | 766 | $ | 1,024 | |||||||||
| (3) Restructuring expenses | ||||||||||||||||
| Cost of product revenues | $ | 1,026 | $ | - | $ | 1,026 | $ | 865 | ||||||||
| Cost of service revenues | - | - | - | 49 | ||||||||||||
| Research and development | - | - | - | 235 | ||||||||||||
| Sales and marketing | - | - | - | 190 | ||||||||||||
| General and administrative | - | - | - | 332 | ||||||||||||
| $ | 1,026 | $ | - | $ | 1,026 | $ | 1,671 | |||||||||
6
KORNIT DIGITAL LTD.
AND ITS SUBSIDIARIES
CONSOLIDATED STATEMENTS OF CASH FLOWS
(U.S. dollars in thousands)
| Three Months Ended | Six Months Ended | |||||||||||||||
| June 30, | June 30, | |||||||||||||||
| 2025 | 2024 | 2025 | 2024 | |||||||||||||
| (Unaudited) | (Unaudited) | |||||||||||||||
| Cash flows from operating activities: | ||||||||||||||||
| Net loss | $ | (7,518 | ) | $ | (4,909 | ) | $ | (12,577 | ) | $ | (18,108 | ) | ||||
| Adjustments to reconcile net loss to net cash provided by operating activities: | ||||||||||||||||
| Depreciation and amortization | 2,930 | 3,191 | 5,776 | 6,515 | ||||||||||||
| Fair value of warrants deducted from revenues | - | (313 | ) | - | 3,273 | |||||||||||
| Share-based compensation | 5,756 | 5,869 | 11,076 | 11,317 | ||||||||||||
| Amortization of premium and accretion of discount on marketable securities, net | (246 | ) | 16 | (550 | ) | 9 | ||||||||||
| Realized loss on sale and redemption of marketable securities | - | - | (22 | ) | - | |||||||||||
| Loss from disposal of property and Equipments | 134 | - | 134 | - | ||||||||||||
| Change in operating assets and liabilities: | ||||||||||||||||
| Trade receivables, net | (3,046 | ) | 1,266 | 1,002 | 14,171 | |||||||||||
| Other accounts receivables and prepaid expenses | (1,507 | ) | 970 | (2,872 | ) | 1,484 | ||||||||||
| Inventory | 5,280 | (3,868 | ) | 7,600 | (3,964 | ) | ||||||||||
| Operating leases right-of-use assets and liabilities, net | 1,590 | (488 | ) | 1,430 | (575 | ) | ||||||||||
| Deposits and other long term assets | (3,234 | ) | (511 | ) | (3,547 | ) | (1,219 | ) | ||||||||
| Trade payables | 5,403 | 1,832 | 93 | (1,933 | ) | |||||||||||
| Employees and payroll accruals | (438 | ) | 1,674 | 1,654 | 522 | |||||||||||
| Deferred revenues and advances from customers | (227 | ) | (364 | ) | (773 | ) | (672 | ) | ||||||||
| Other payables and accrued expenses | (531 | ) | 123 | 1,699 | (2,190 | ) | ||||||||||
| Accrued severance pay, net | (588 | ) | (30 | ) | (617 | ) | (62 | ) | ||||||||
| Other long - term liabilities | (28 | ) | 26 | (12 | ) | (60 | ) | |||||||||
| Net cash provided by operating activities | 3,730 | 4,484 | 9,494 | 8,508 | ||||||||||||
| Cash flows from investing activities: | ||||||||||||||||
| Purchase of property, plant and equipment | (5,808 | ) | (1,439 | ) | (9,579 | ) | (2,723 | ) | ||||||||
| Proceeds from (investment in) short-term bank deposits, net | (79,503 | ) | 16,601 | (100,503 | ) | (7,796 | ) | |||||||||
| Proceeds from sales and redemption of marketable securities | 3,260 | - | 6,060 | 3,494 | ||||||||||||
| Proceeds from maturities of marketable securities | 77,802 | 24,581 | 143,122 | 35,879 | ||||||||||||
| Investment in marketable securities | (6,763 | ) | (26,602 | ) | (32,578 | ) | (44,619 | ) | ||||||||
| Net cash provided by (used in) investing activities | (11,012 | ) | 13,141 | 6,522 | (15,765 | ) | ||||||||||
| Cash flows from financing activities: | ||||||||||||||||
| Exercise of employee stock options | 239 | 7 | 768 | 7 | ||||||||||||
| Payments related to shares withheld for taxes | (392 | ) | (184 | ) | (1,369 | ) | (778 | ) | ||||||||
| Repurchase of ordinary shares | (23,176 | ) | (1,427 | ) | (25,000 | ) | (9,055 | ) | ||||||||
| Net cash used in financing activities | (23,329 | ) | (1,604 | ) | (25,601 | ) | (9,826 | ) | ||||||||
| Increase (decrease) in cash and cash equivalents | (30,611 | ) | 16,021 | (9,585 | ) | (17,083 | ) | |||||||||
| Cash and cash equivalents at the beginning of the period | 56,029 | 6,501 | 35,003 | 39,605 | ||||||||||||
| Cash and cash equivalents at the end of the period | $ | 25,418 | $ | 22,522 | $ | 25,418 | $ | 22,522 | ||||||||
| Non-cash investing and financing activities: | ||||||||||||||||
| Purchase of property and equipment on credit | 1,167 | 105 | 1,167 | 105 | ||||||||||||
| Inventory transferred to be used as property and equipment | 2,548 | 455 | 2,953 | 1,401 | ||||||||||||
| Property, plant and equipment transferred to be used as inventory | 234 | 166 | 234 | 320 | ||||||||||||
| Lease liabilities arising from obtaining right-of-use assets | 561 | 338 | 1,083 | (1,408 | ) | |||||||||||
7
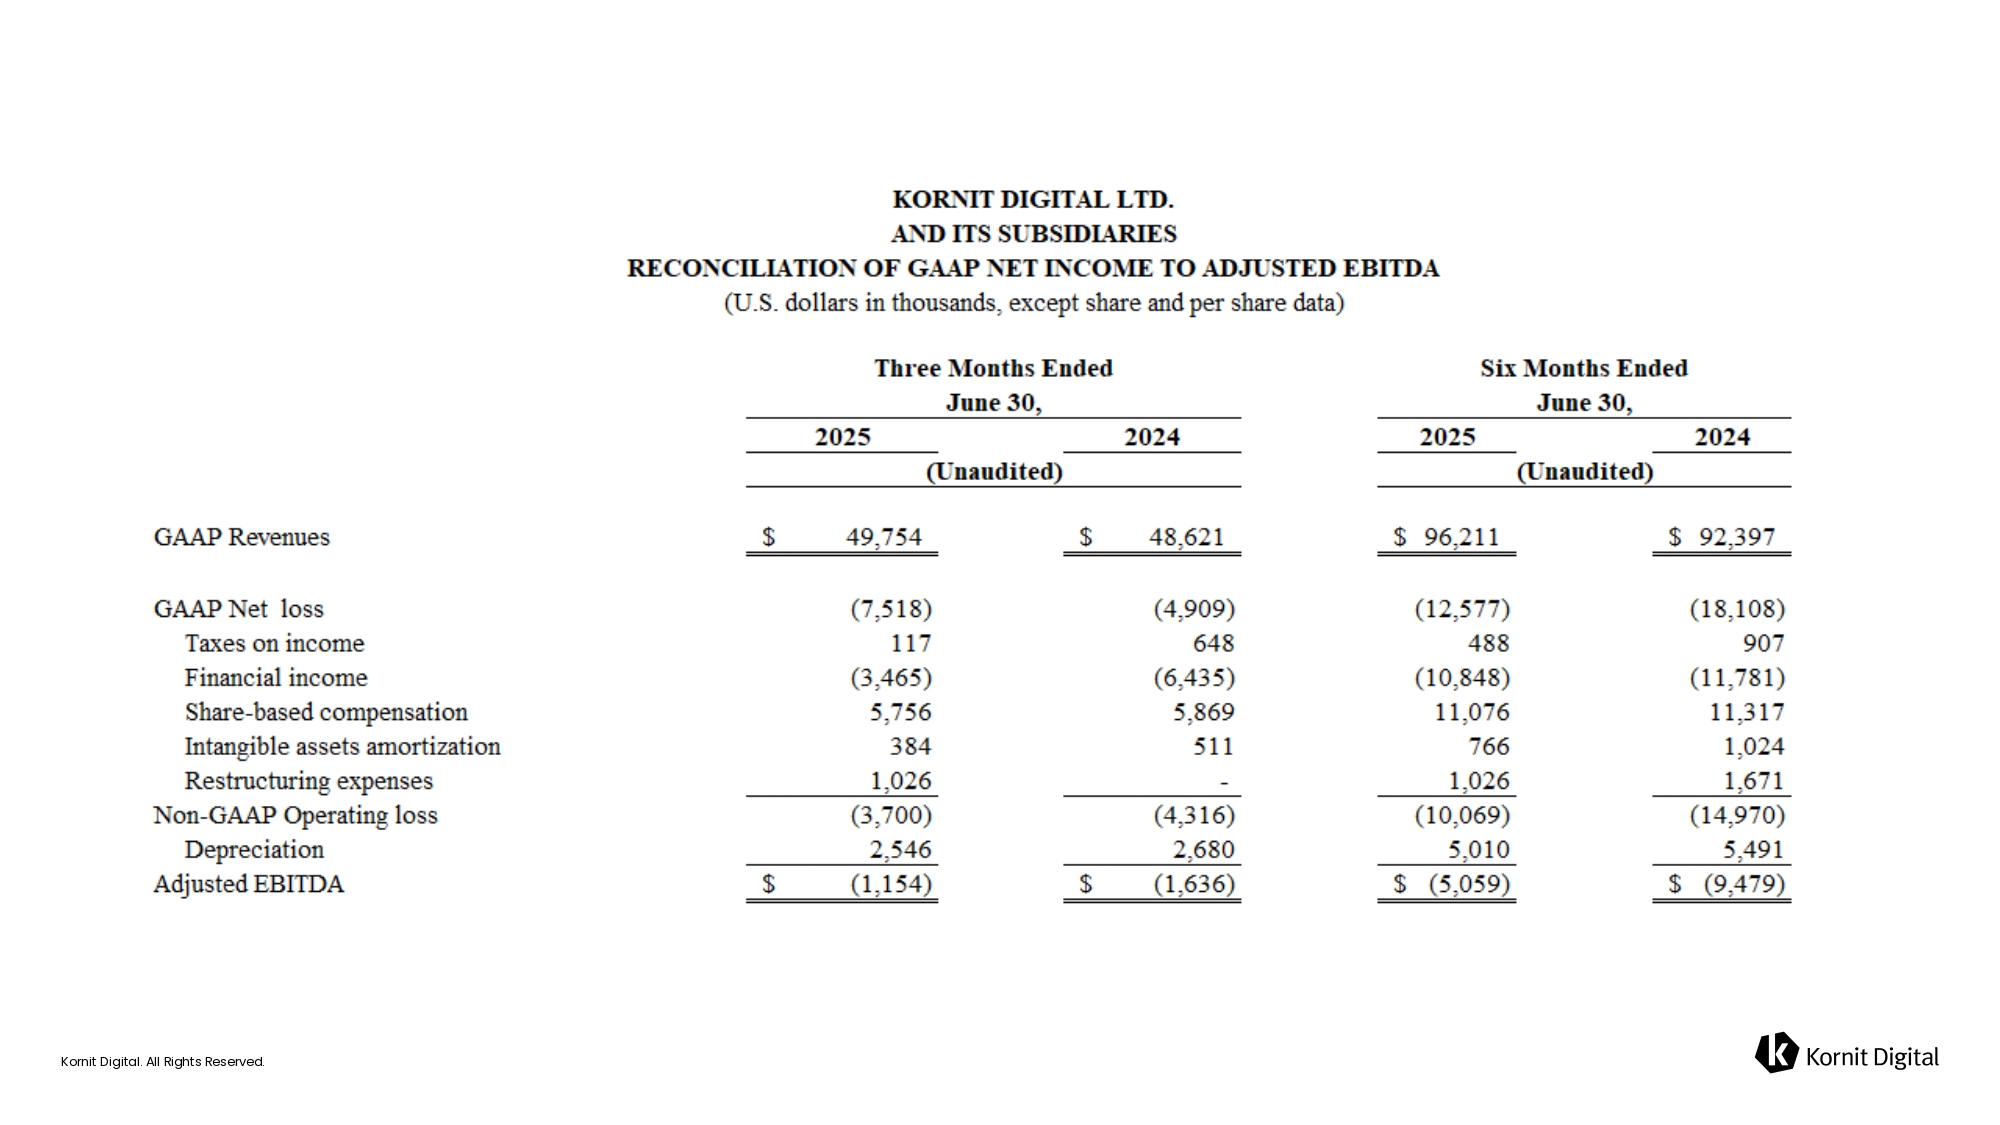
KORNIT DIGITAL LTD.
AND ITS SUBSIDIARIES
RECONCILIATION OF GAAP NET INCOME TO ADJUSTED EBITDA
(U.S. dollars in thousands, except share and per share data)
| Three Months Ended | Six Months Ended | |||||||||||||||
| June 30, | June 30, | |||||||||||||||
| 2025 | 2024 | 2025 | 2024 | |||||||||||||
| (Unaudited) | (Unaudited) | |||||||||||||||
| GAAP Revenues | $ | 49,754 | $ | 48,621 | $ | 96,211 | $ | 92,397 | ||||||||
| GAAP Net loss | (7,518 | ) | (4,909 | ) | (12,577 | ) | (18,108 | ) | ||||||||
| Taxes on income | 117 | 648 | 488 | 907 | ||||||||||||
| Financial income | (3,465 | ) | (6,435 | ) | (10,848 | ) | (11,781 | ) | ||||||||
| Share-based compensation | 5,756 | 5,869 | 11,076 | 11,317 | ||||||||||||
| Intangible assets amortization | 384 | 511 | 766 | 1,024 | ||||||||||||
| Restructuring expenses | 1,026 | - | 1,026 | 1,671 | ||||||||||||
| Non-GAAP Operating loss | (3,700 | ) | (4,316 | ) | (10,069 | ) | (14,970 | ) | ||||||||
| Depreciation | 2,546 | 2,680 | 5,010 | 5,491 | ||||||||||||
| Adjusted EBITDA | $ | (1,154 | ) | $ | (1,636 | ) | $ | (5,059 | ) | $ | (9,479 | ) | ||||
8
Exhibit 99.2

Kornit Digital. All Rights Reserved. Kornit Digital. All Rights Reserved. Kornit Digital (NASDAQ: KRNT) Second Quarter 2025 Earnings Conference Call Supporting Slides August 6, 2025 Kornit Digital. All Rights Reserved.

Kornit Digital. All Rights Reserved. On Today’s Call Ronen Samuel CEO Lauri Hanover CFO Jared Maymon Investor Relations
Kornit Digital. All Rights Reserved. Safe Harbor This presentation contains “forward - looking statements” within the meaning of the Private Securities Litigation Reform Act of 1995 and other U . S . securities laws . Forward - looking statements are characterized by the use of forward - looking terminology such as “will,” “expects,” “anticipates,” “continue,” “believes,” “should,” “intended,” “guidance,” “preliminary,” “future,” “planned,” or other words . These forward - looking statements include, but are not limited to, statements relating to the Company’s objectives, plans and strategies, statements of preliminary or projected results of operations or of financial condition and all statements that address activities, events, or developments that the Company intends, expects, projects, believes or anticipates will or may occur in the future . Forward - looking statements are not guarantees of future performance and are subject to risks and uncertainties . The Company has based these forward - looking statements on assumptions and assessments made by its management in light of their experience and their perception of historical trends, current conditions, expected future developments and other factors they believe to be appropriate . Important factors that could cause actual results, developments and business decisions to differ materially from those anticipated in these forward - looking statements include, among other things : the duration and severity of adverse macro - economic headwinds that were caused by inflationary pressures and higher interest rates, which have impacted, and may continue to impact, in an adverse manner, the Company’s operations, financial position and cash flows, in part due to the adverse impact on the Company’s customers and suppliers ; the Company’s degree of success in developing, introducing and selling new or improved products and product enhancements including specifically the Company’s Poly Pro and Presto products, and the Company’s Apollo direct - to - garment platform ; the extent of the Company’s ability to consummate sales to large accounts with multi - system delivery plans ; the degree of the Company’s ability to fill orders for its systems and consumables ; the extent of the Company’s ability to increase sales of its systems, ink and consumables ; the extent of the Company’s ability to leverage its global infrastructure build - out ; the development of the market for digital textile printing ; the availability of alternative ink ; competition ; sales concentration ; changes to the Company’s relationships with suppliers ; the extent of the Company’s success in marketing ; and those additional factors referred to under “Risk Factors” in Item 3 . D of the Company’s Annual Report on Form 20 - F for the year ended December 31 , 2024 , filed with the SEC on March 28 , 2025 . Any forward - looking statements in this press release are made as of the date hereof, whether as a result of new information, future events or otherwise, except as required by law . In addition to U . S . GAAP financials, this presentation includes certain non - GAAP financial measures . These non - GAAP financial measures are in addition to, and not a substitute for or superior to, measures of financial performance prepared in accordance with U . S . GAAP . Please see the reconciliation table that appears among the financial tables in our earnings release being issued today, which earnings release is attached as Exhibit 99 . 1 to our report of foreign private issuer on Form 6 - K being furnished to the SEC today, which reconciliation table is incorporated by reference in this presentation . This presentation contains statistical data that we obtained from industry publications and reports generated by third parties . Although we believe that the publications and reports are reliable, we have not independently verified this statistical data . Kornit , Kornit Digital, the K logo, and NeoPigment are trademarks of Kornit Digital Ltd . All other trademarks are the property of their respective owners and are used for reference purposes only . Such use should not be construed as an endorsement of our products or services .

Kornit Digital. All Rights Reserved. Business Highlights
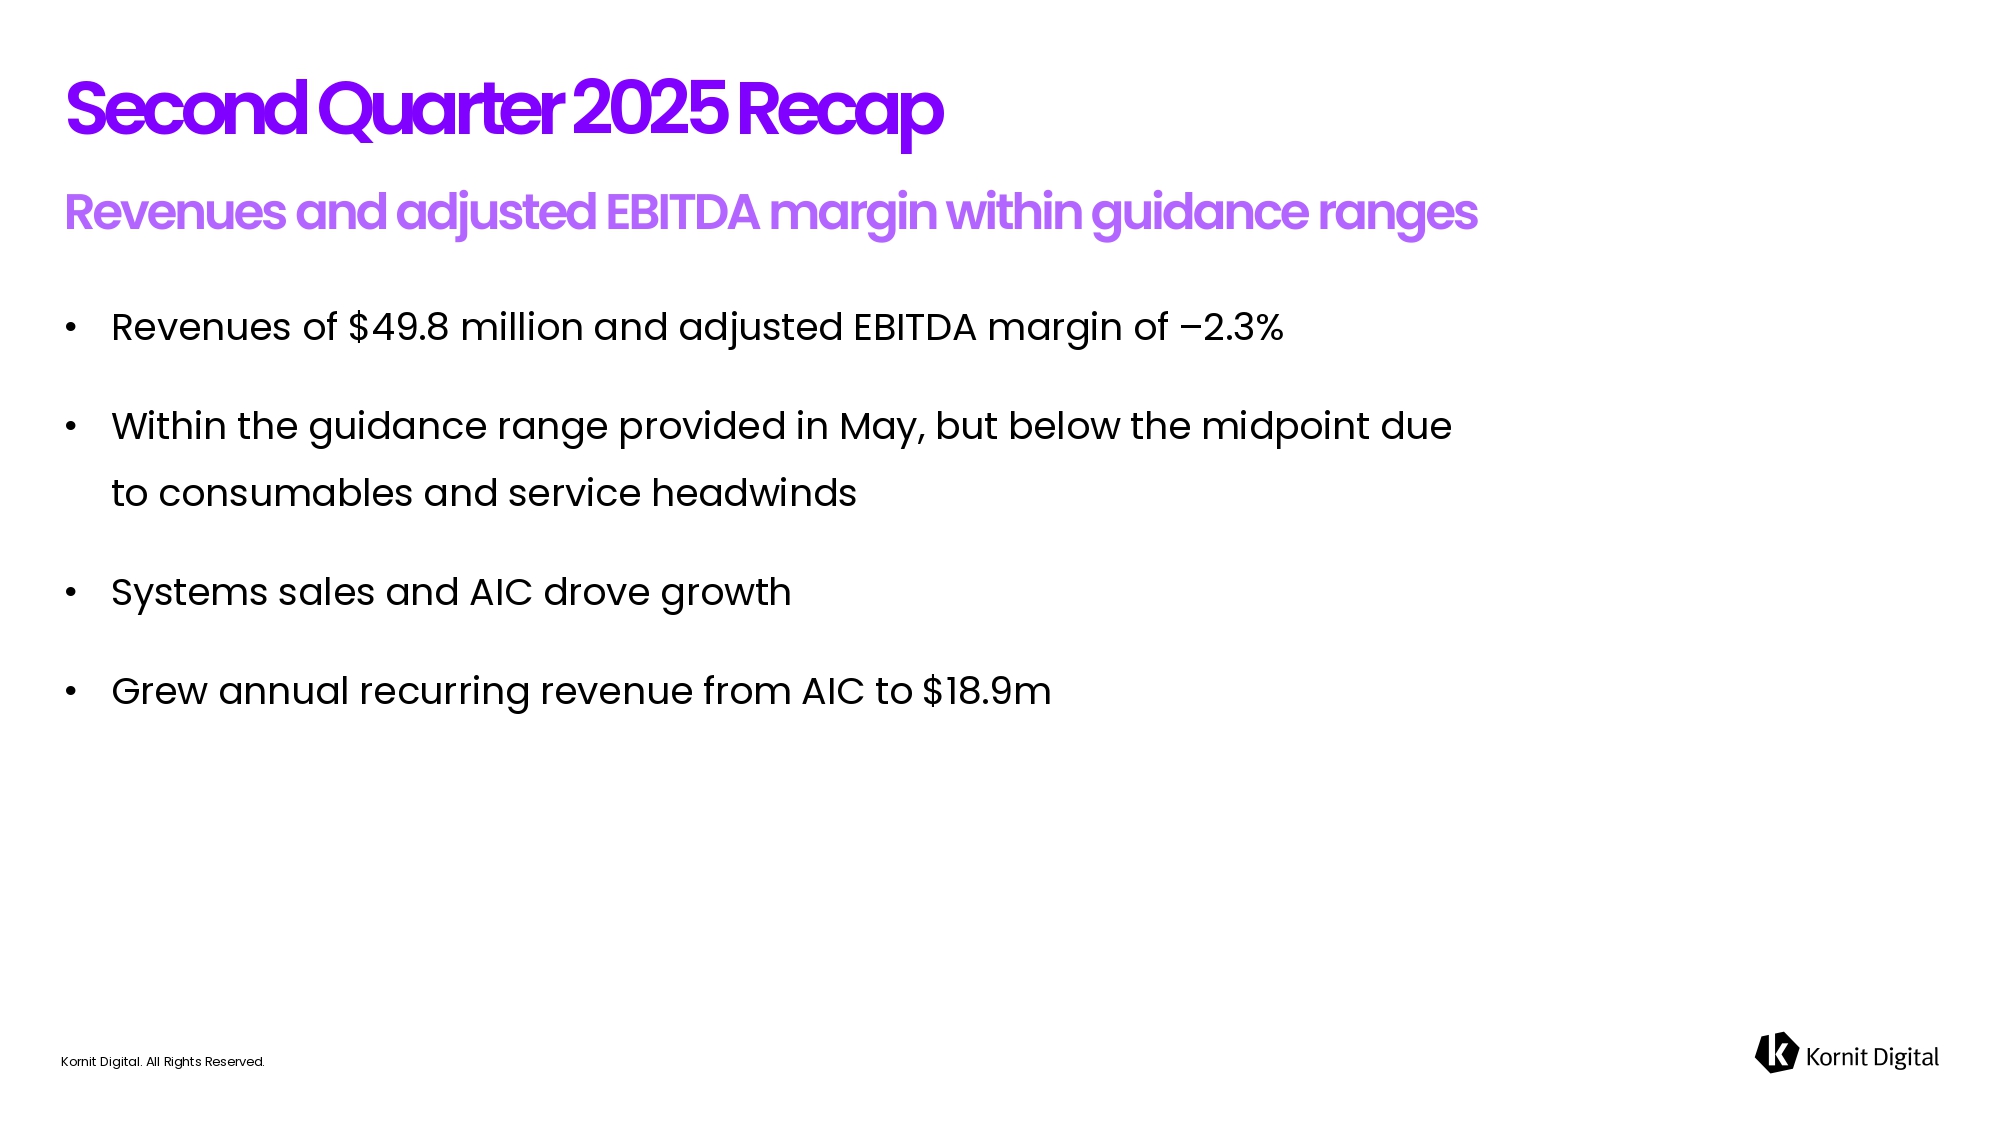
Kornit Digital. All Rights Reserved. • Revenues of $49.8 million and adjusted EBITDA margin of – 2.3% • Within the guidance range provided in May, but below the midpoint due to consumables and service headwinds • Systems sales and AIC drove growth • Grew annual recurring revenue from AIC to $18.9m Second Quarter 2025 Recap
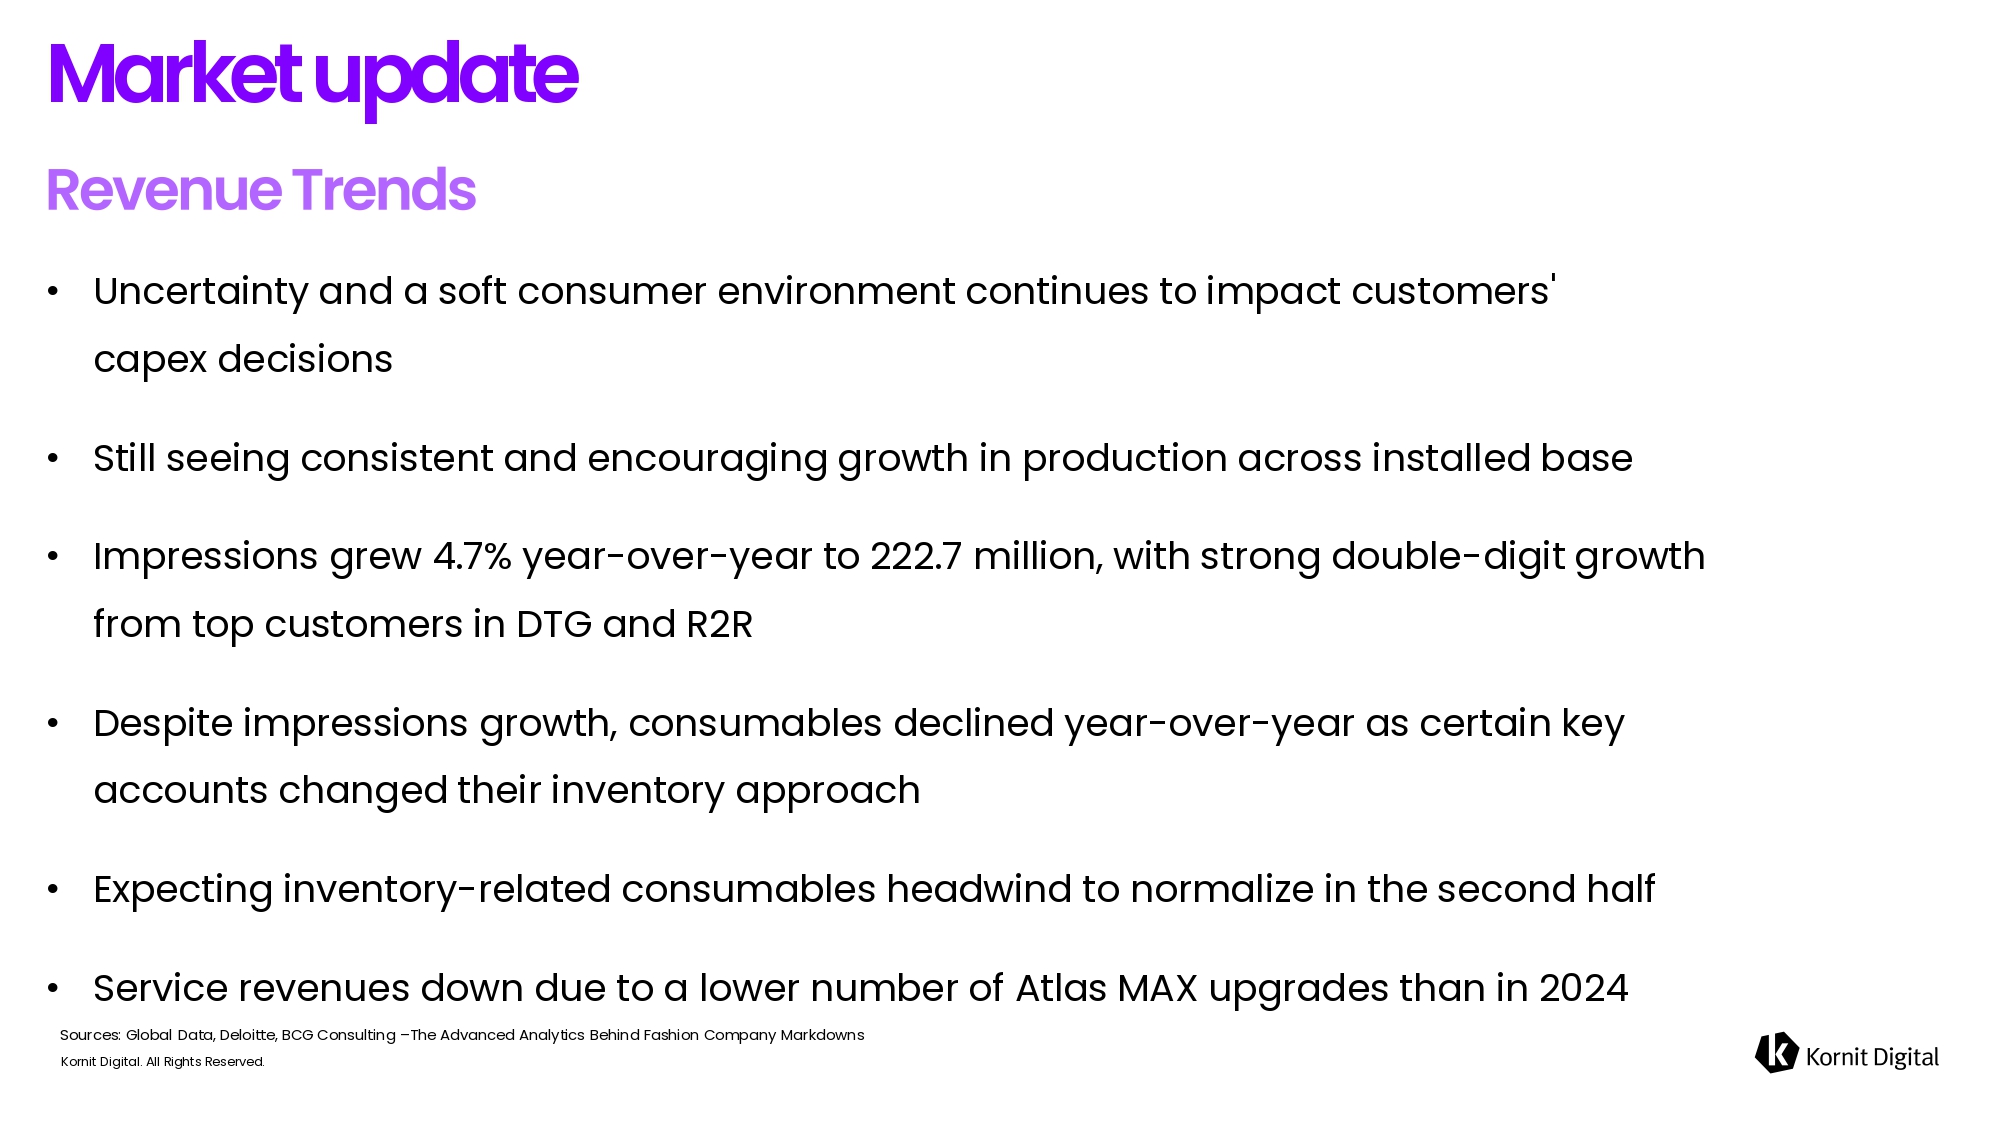
Kornit Digital. All Rights Reserved. • Uncertainty and a soft consumer environment continues to impact customers' capex decisions • Still seeing consistent and encouraging growth in production across installed base • Impressions grew 4.7% year - over - year to 222.7 million, with strong double - digit growth from top customers in DTG and R2R • Despite impressions growth, consumables declined year - over - year as certain key accounts changed their inventory approach • Expecting inventory - related consumables headwind to normalize in the second half • Service revenues down due to a lower number of Atlas MAX upgrades than in 2024 Market update Sources: Global Data, Deloitte, BCG Consulting – The Advanced Analytics Behind Fashion Company Markdowns
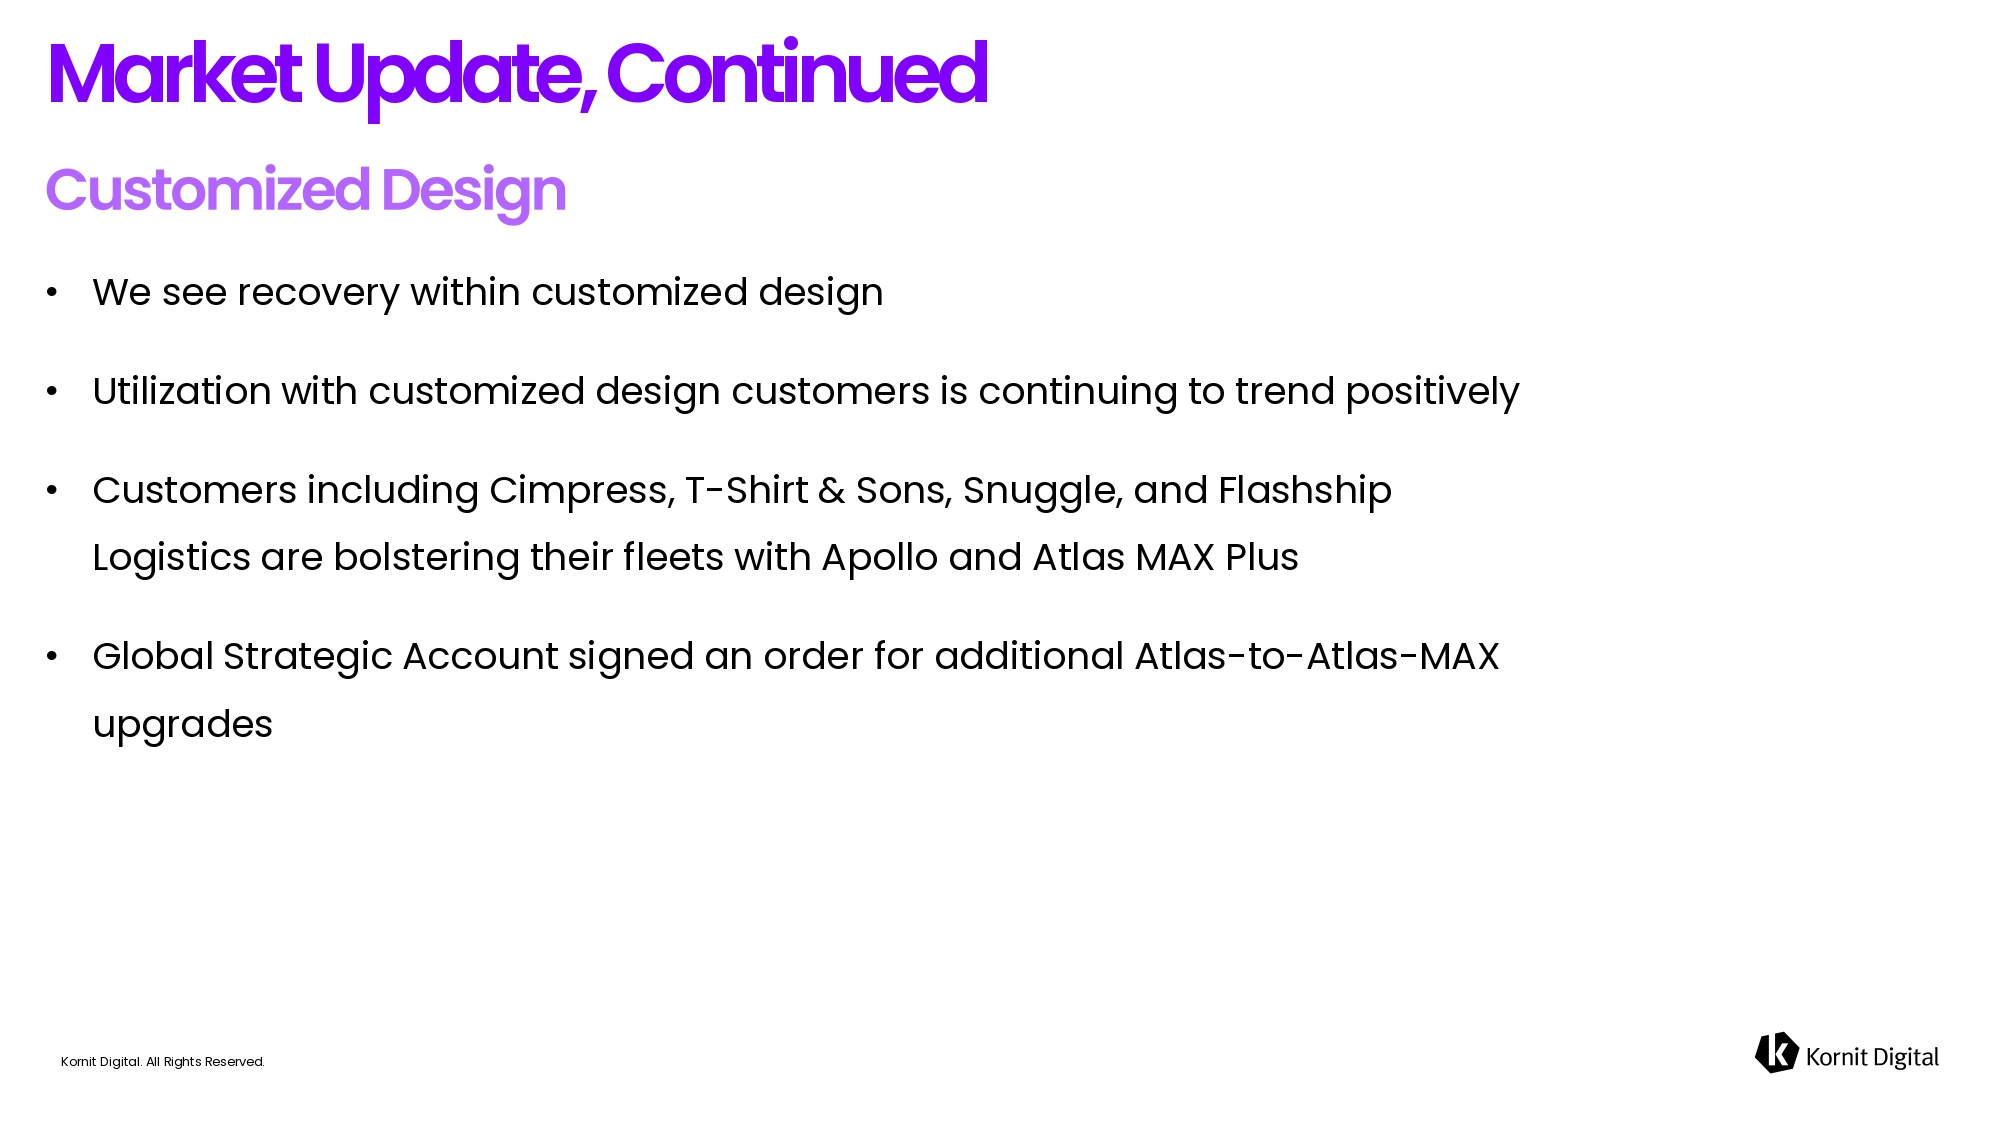
Kornit Digital. All Rights Reserved. • We see recovery within customized design • Utilization with customized design customers is continuing to trend positively • Customers including Cimpress , T - Shirt & Sons, Snuggle, and Flashship Logistics are bolstering their fleets with Apollo and Atlas MAX Plus • Global Strategic Account signed an order for additional Atlas - to - Atlas - MAX upgrades Market Update, Continued
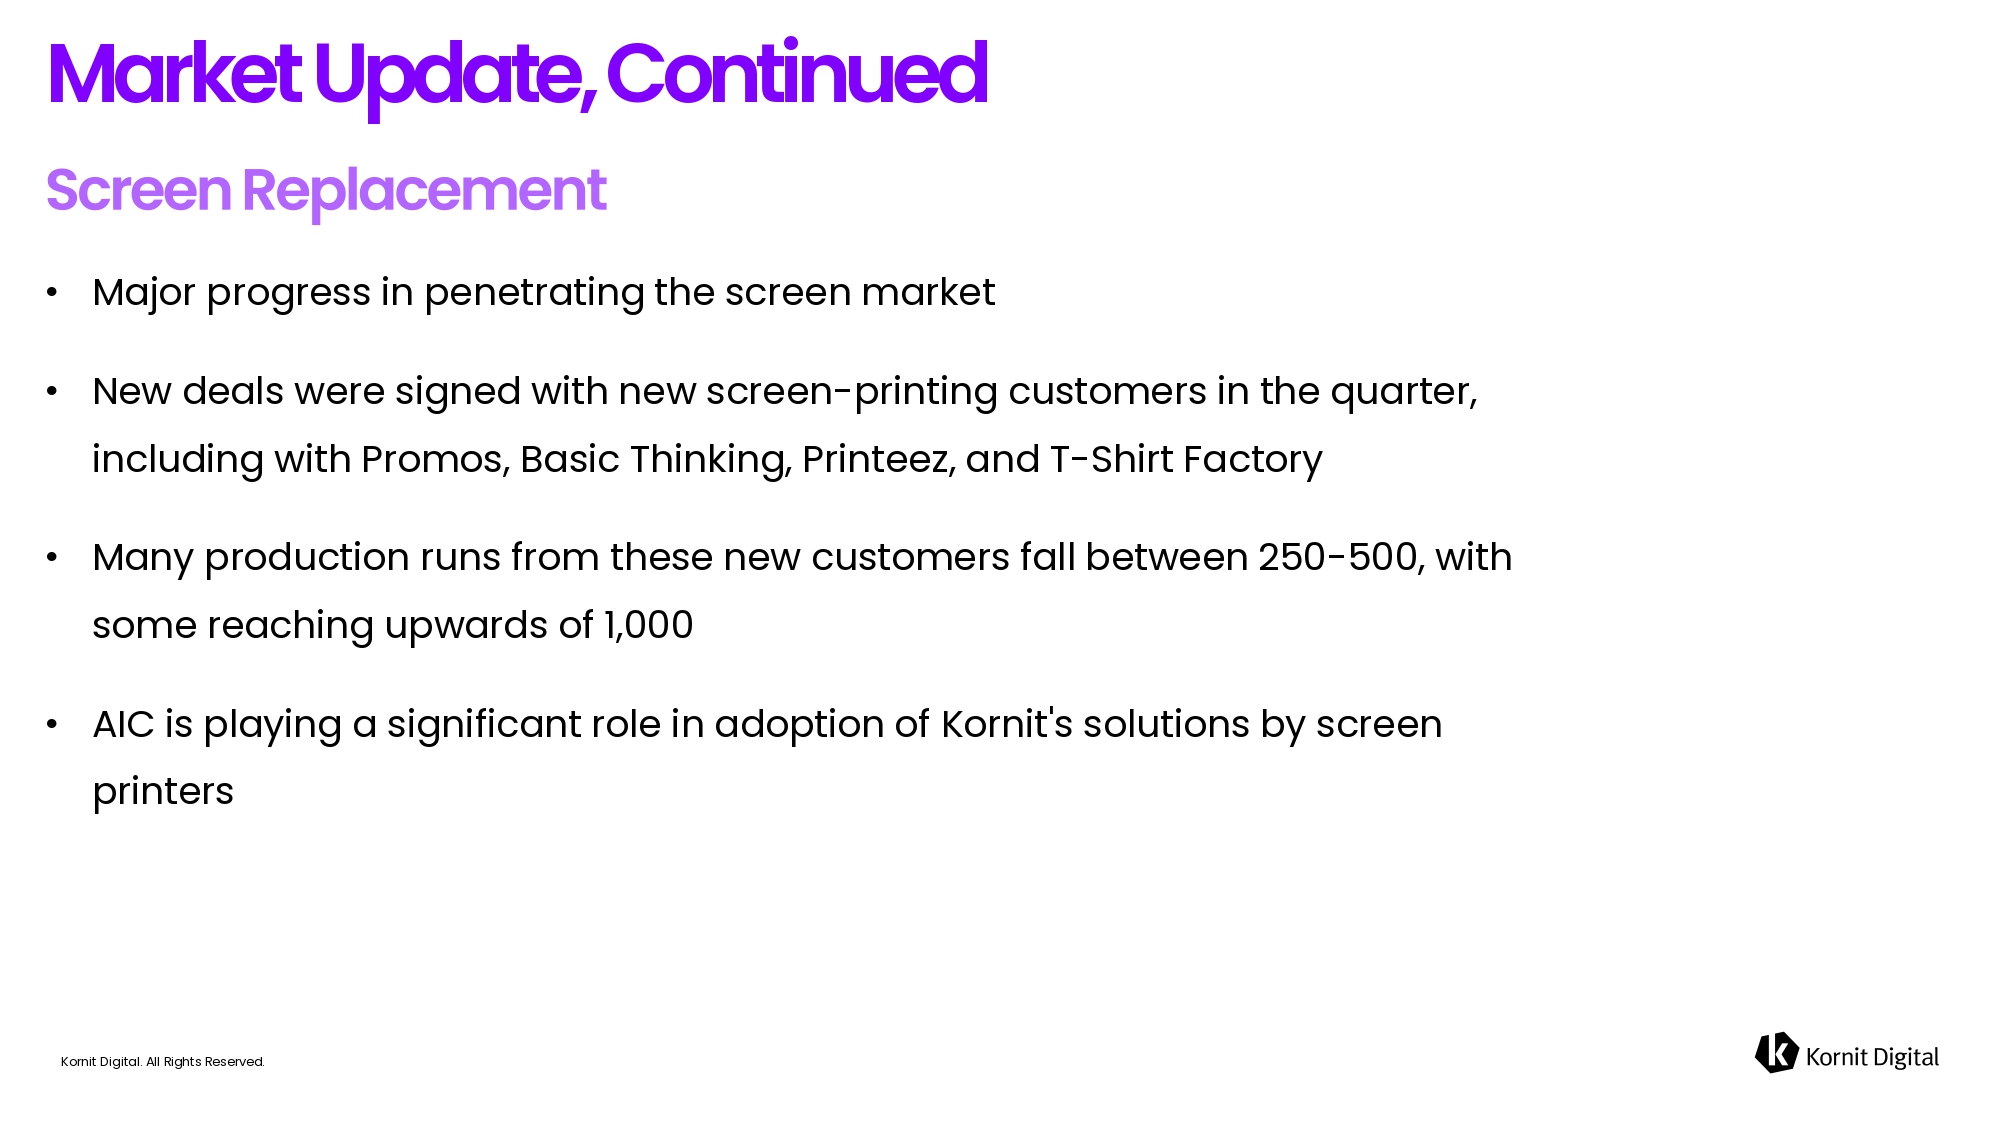
Kornit Digital. All Rights Reserved. • Major progress in penetrating the screen market • New deals were signed with new screen - printing customers in the quarter, including with Promos, Basic Thinking, Printeez , and T - Shirt Factory • Many production runs from these new customers fall between 250 - 500, with some reaching upwards of 1,000 • AIC is playing a significant role in adoption of Kornit's solutions by screen printers Market Update, Continued
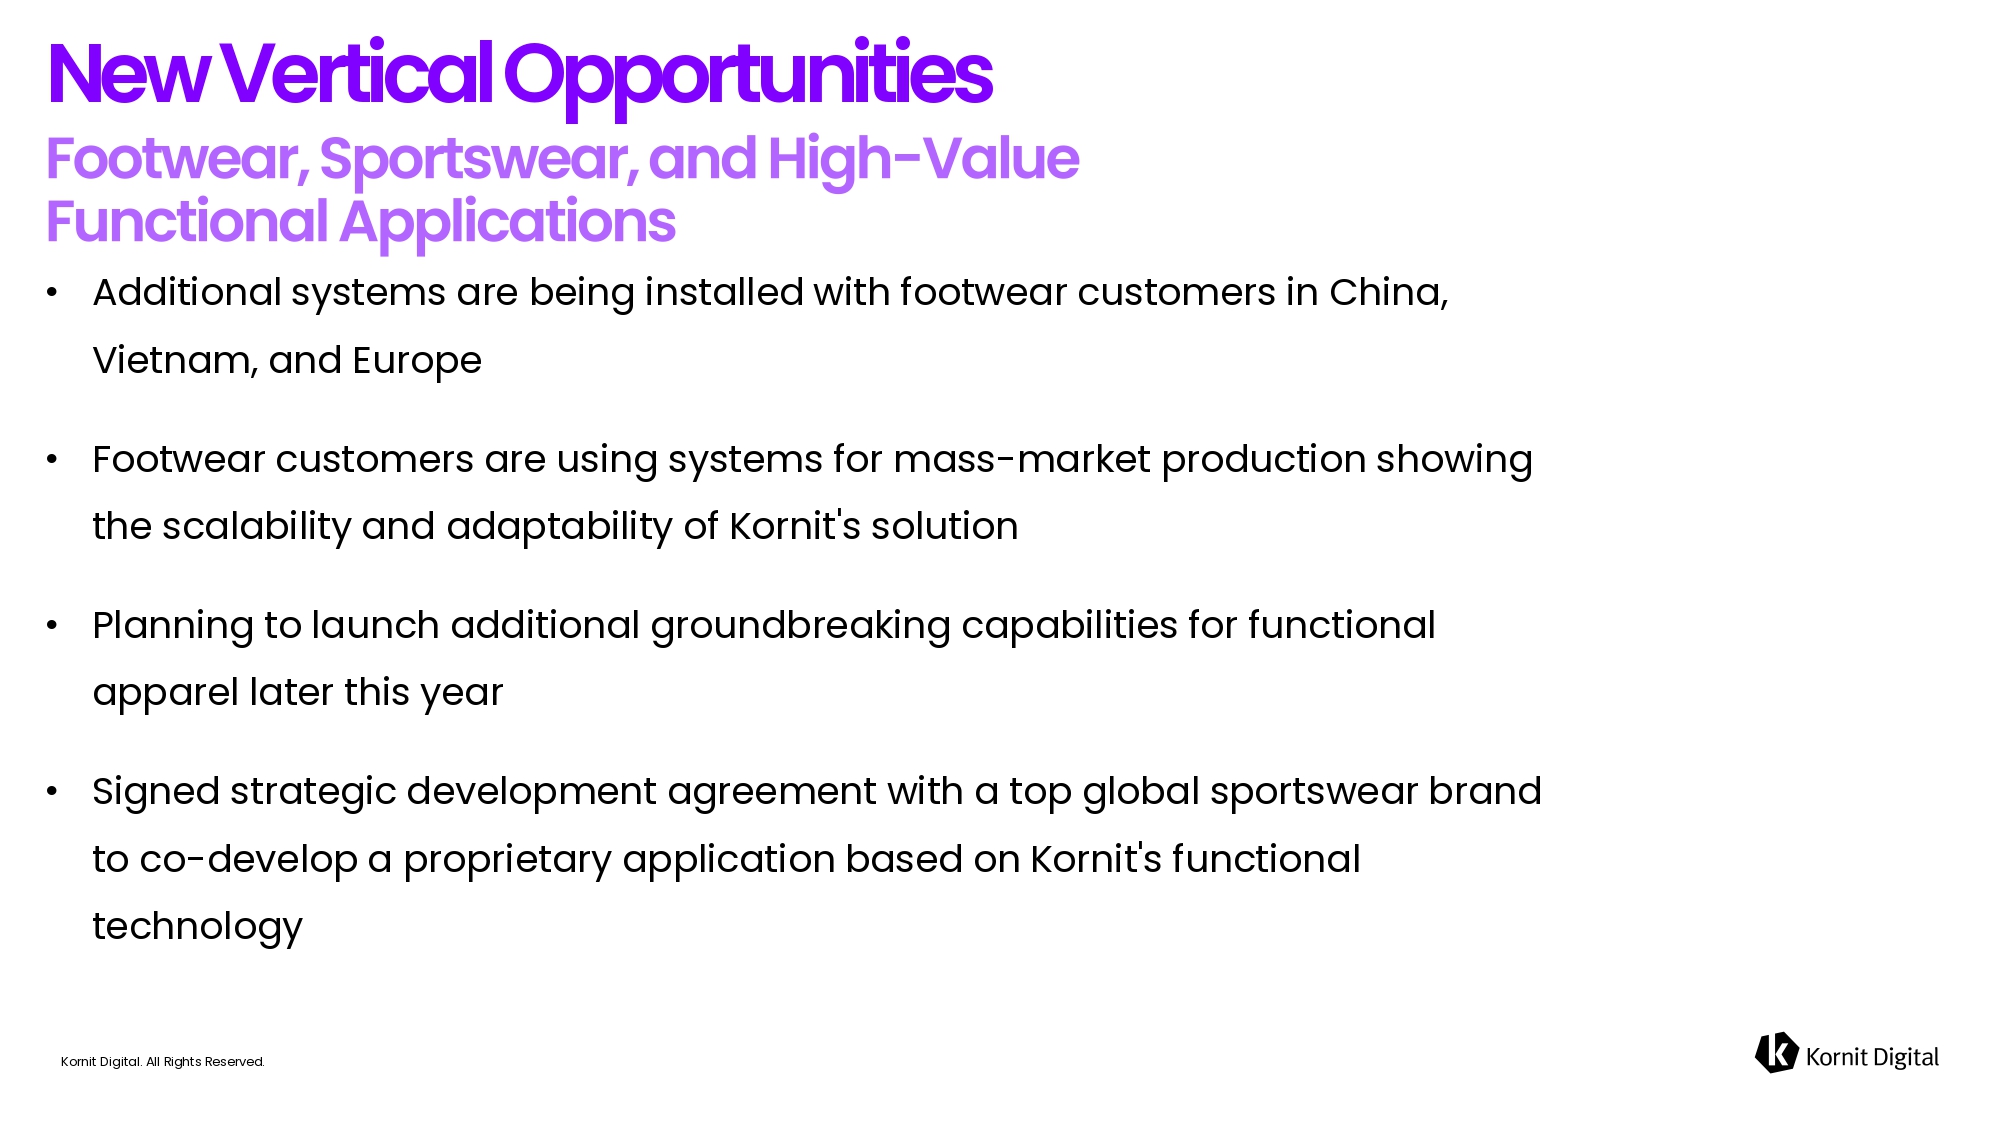
Kornit Digital. All Rights Reserved. • Additional systems are being installed with footwear customers in China, Vietnam, and Europe • Footwear customers are using systems for mass - market production showing the scalability and adaptability of Kornit's solution • Planning to launch additional groundbreaking capabilities for functional apparel later this year • Signed strategic development agreement with a top global sportswear brand to co - develop a proprietary application based on Kornit's functional technology New Vertical Opportunities
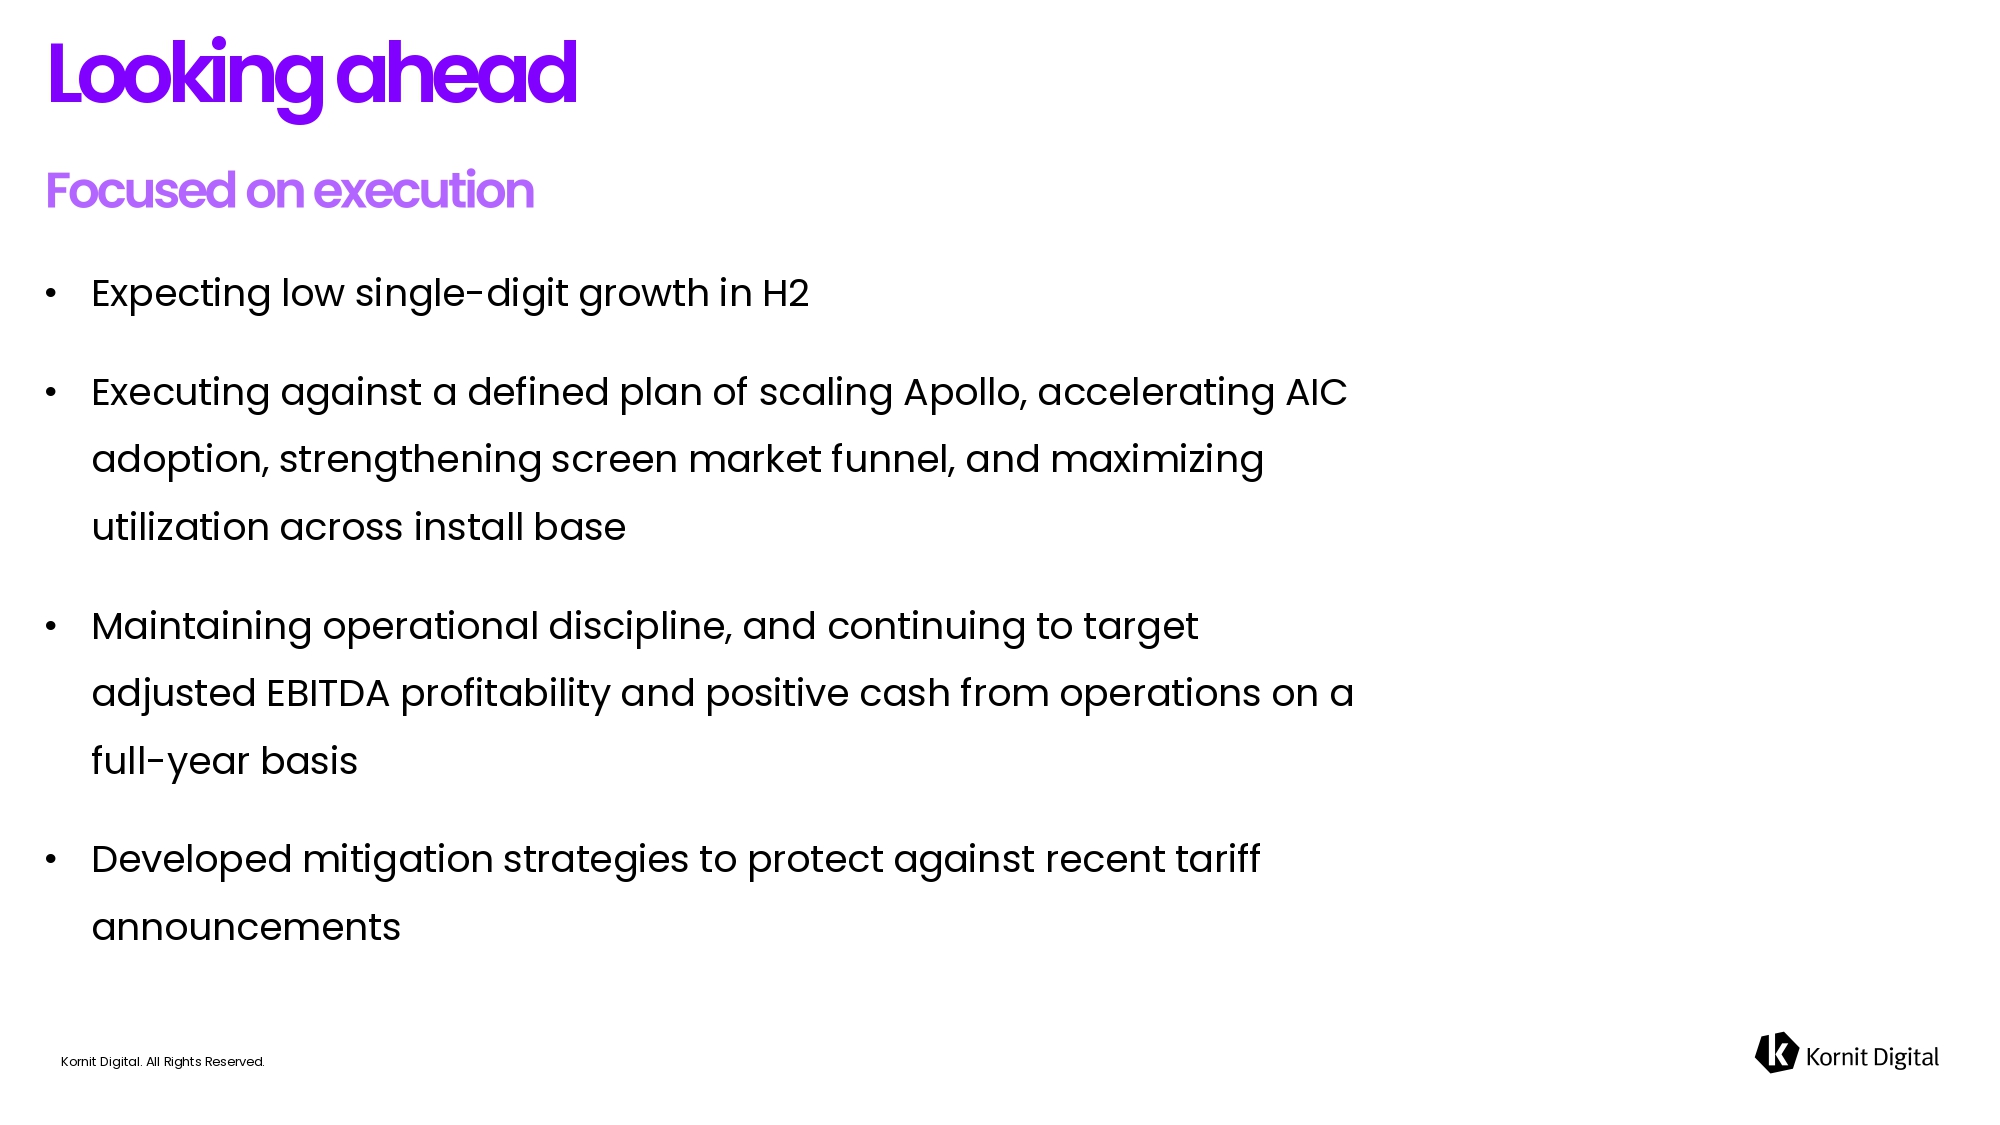
Kornit Digital. All Rights Reserved. • Expecting low single - digit growth in H2 • Executing against a defined plan of scaling Apollo, accelerating AIC adoption, strengthening screen market funnel, and maximizing utilization across install base • Maintaining operational discipline, and continuing to target adjusted EBITDA profitability and positive cash from operations on a full - year basis • Developed mitigation strategies to protect against recent tariff announcements Looking ahead

Kornit Digital. All Rights Reserved. Financial Highlights
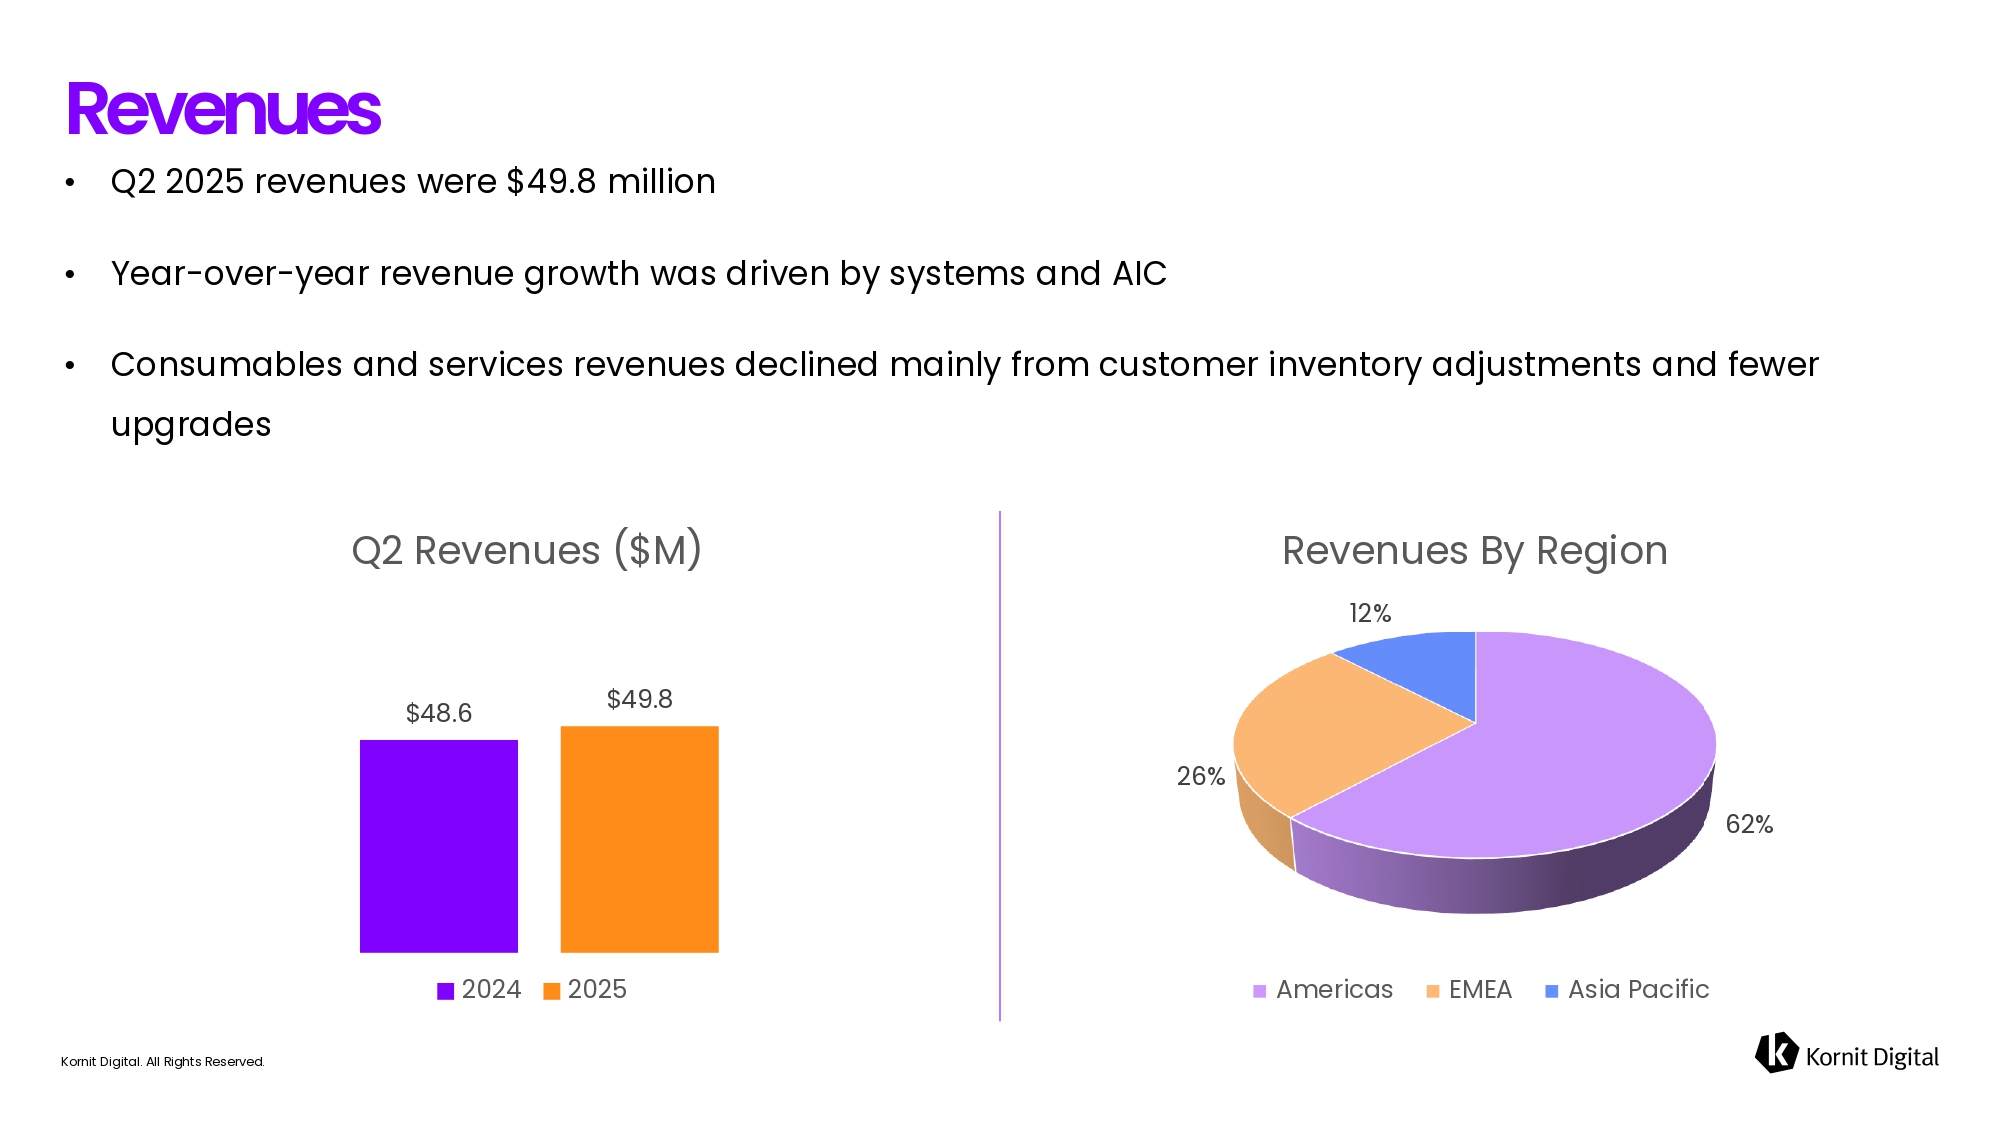
Kornit Digital. All Rights Reserved. • Q2 2025 revenues were $49.8 million • Year - over - year revenue growth was driven by systems and AIC • Consumables and services revenues declined mainly from customer inventory adjustments and fewer upgrades Revenues $48.6 $49.8 Q2 Revenues ($M) 2024 2025 62% 26% 12% Revenues By Region Americas EMEA Asia Pacific
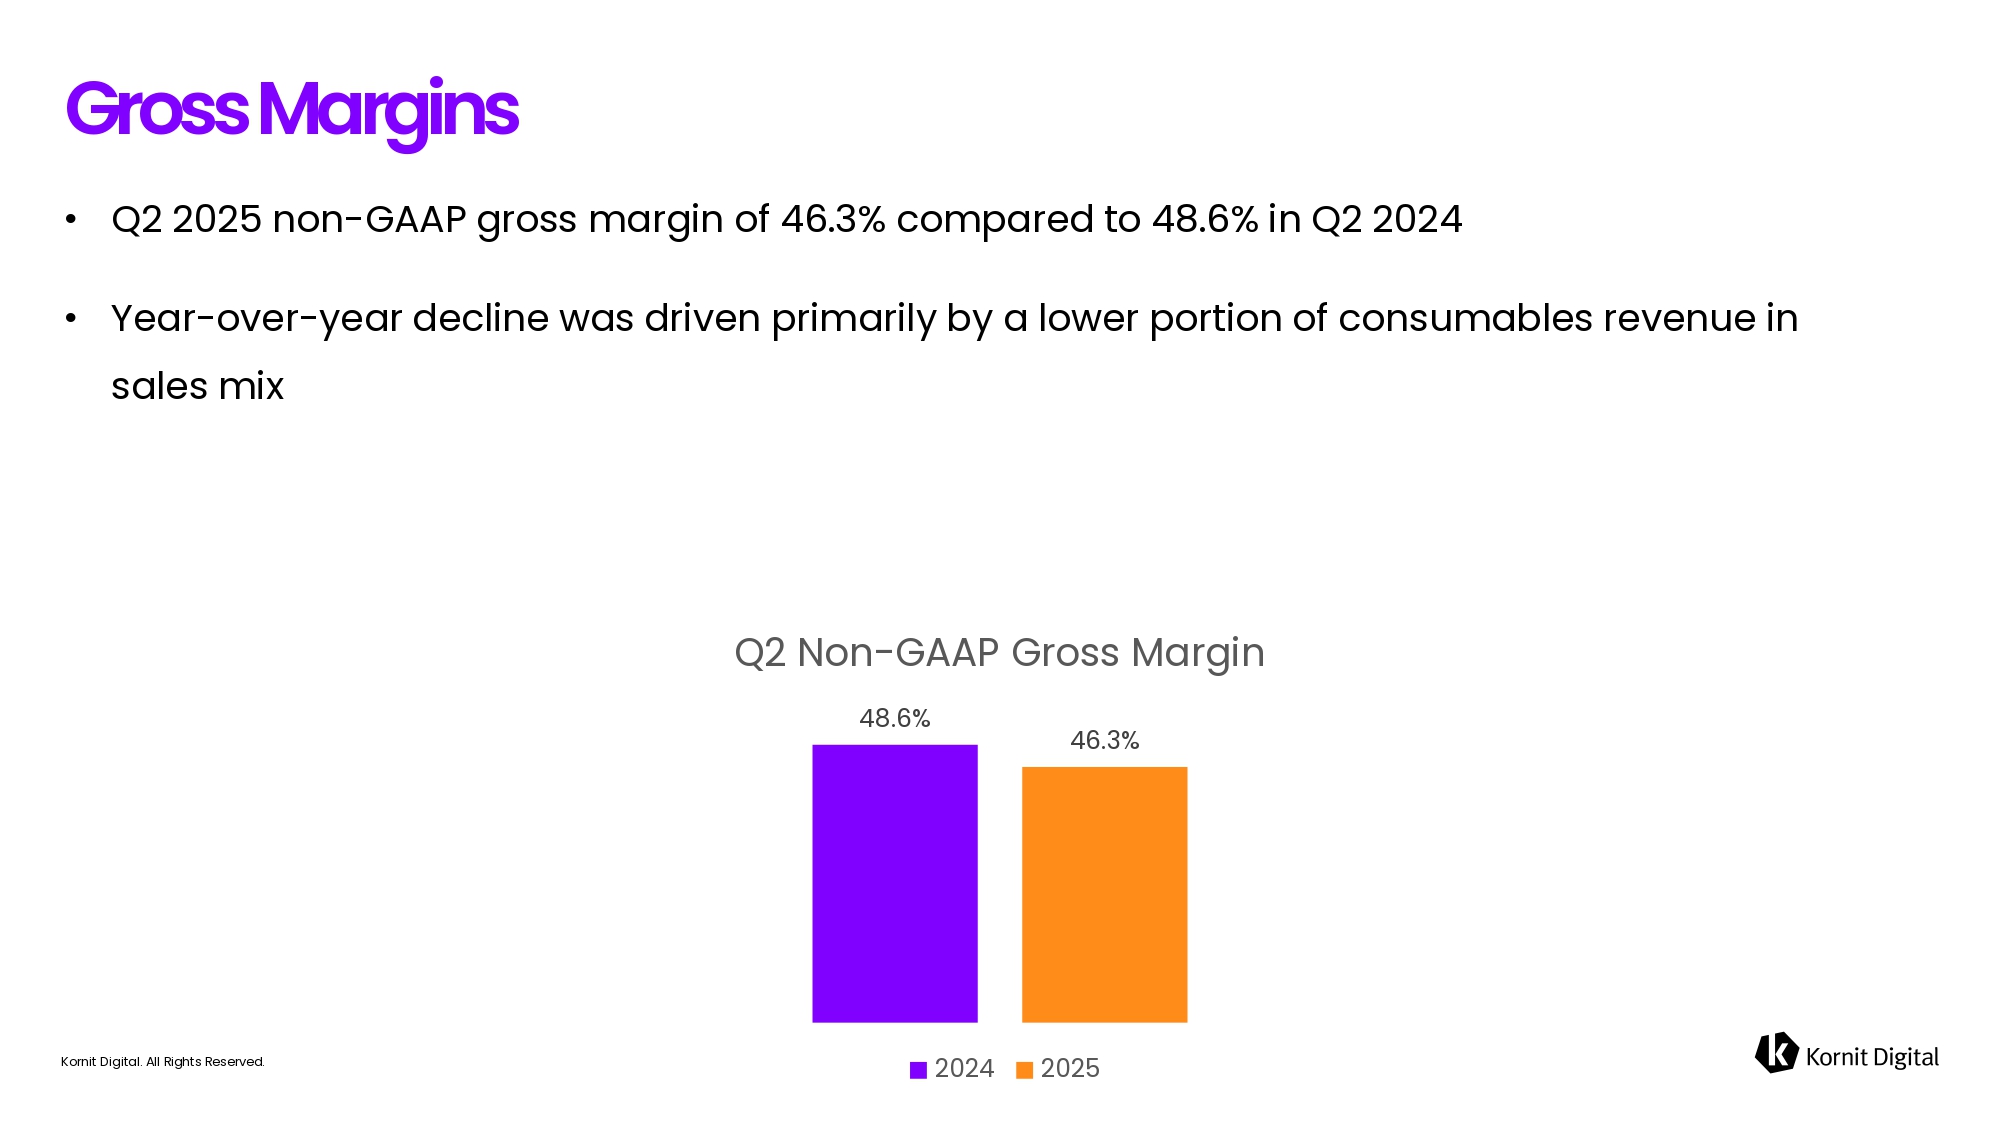
Kornit Digital. All Rights Reserved. • Q2 2025 non - GAAP gross margin of 46.3% compared to 48.6% in Q2 2024 • Year - over - year decline was driven primarily by a lower portion of consumables revenue in sales mix Gross Margins 48.6% 46.3 % Q2 Non - GAAP Gross Margin 2024 2025
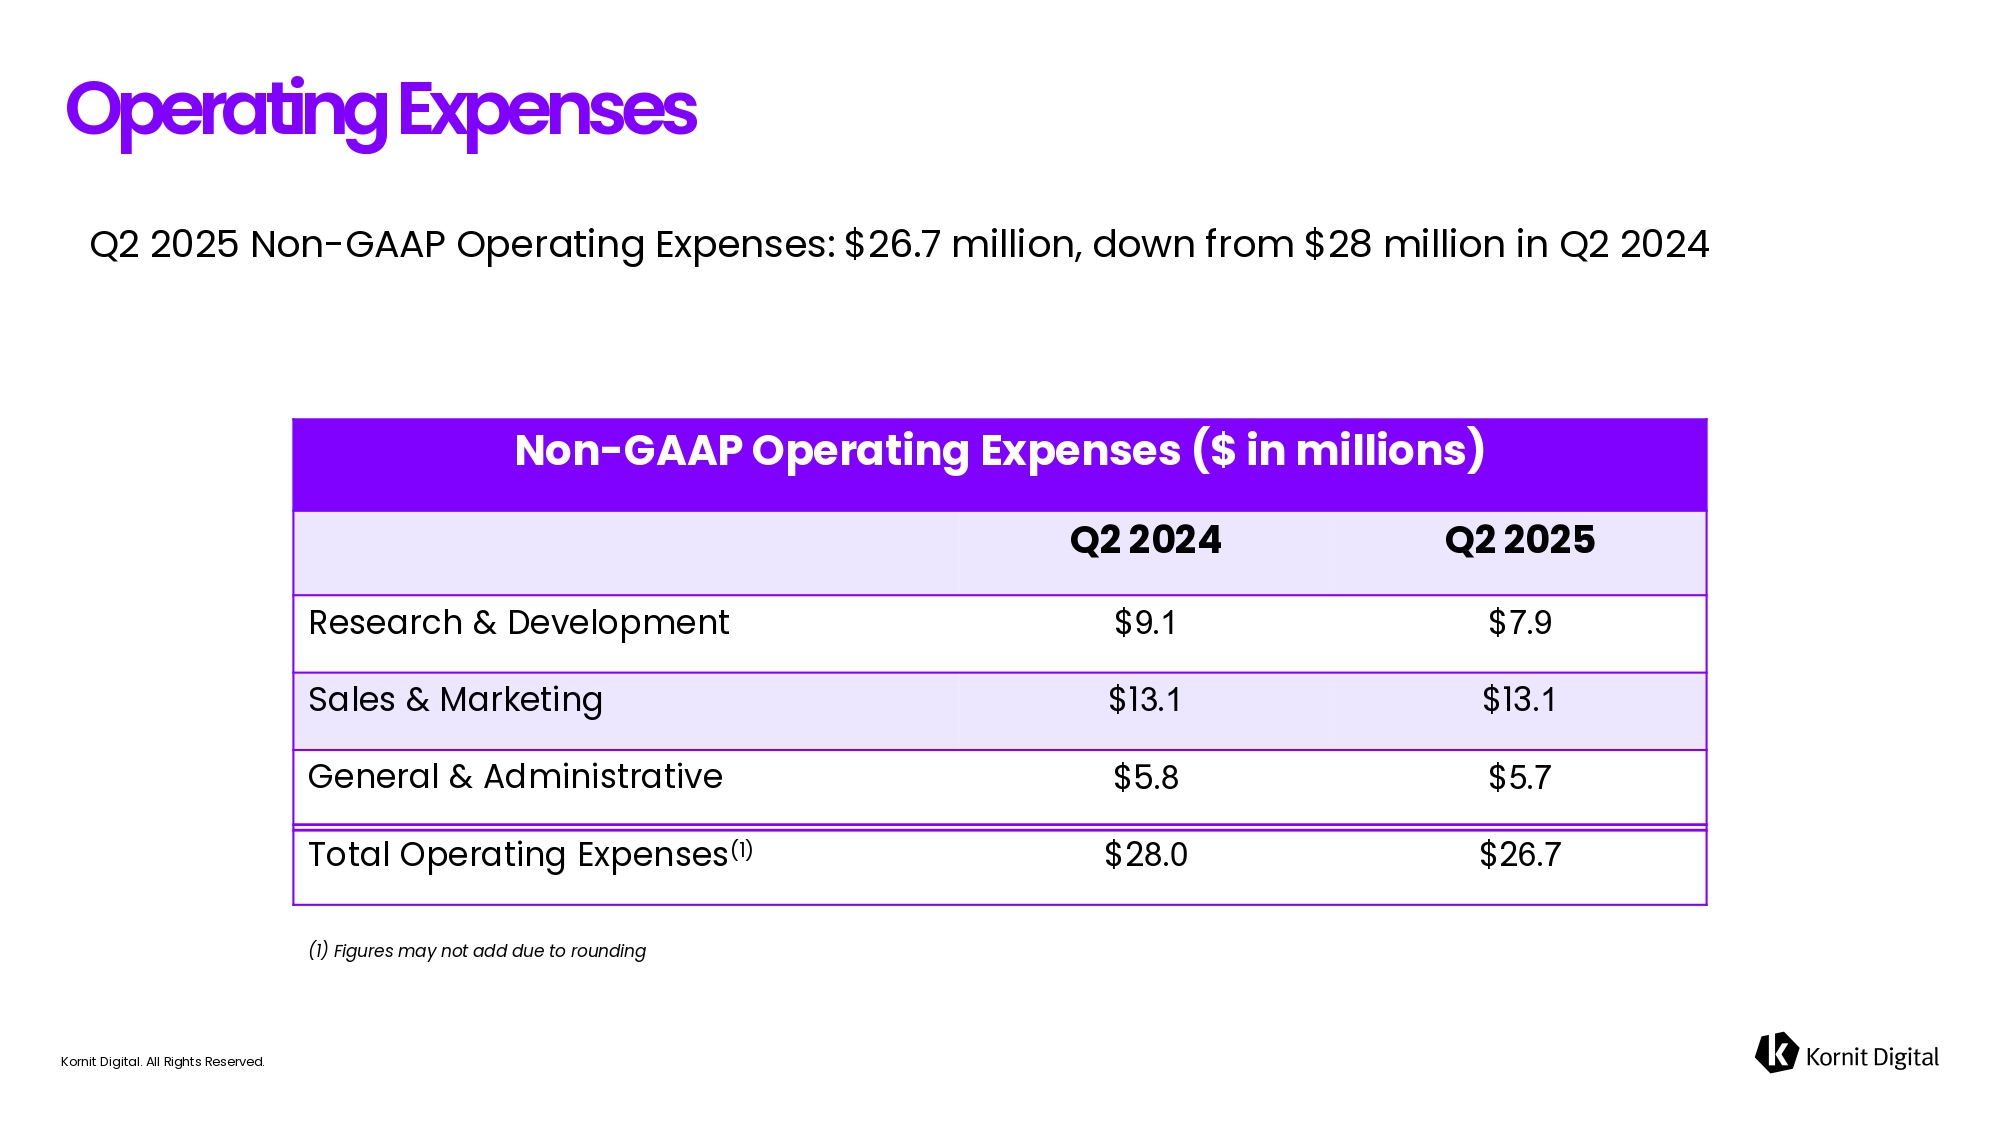
Kornit Digital. All Rights Reserved. Q2 2025 Non - GAAP Operating Expenses: $26.7 million, down from $28 million in Q2 2024 Operating Expenses Non - GAAP Operating Expenses ($ in millions) Q2 2025 Q2 2024 $ . $ . Research & Development $ 13. $ 1 . Sales & Marketing $ . $ 5. General & Administrative $ 2 . $ 2 . Total Operating Expenses (1) (1) Figures may not add due to rounding
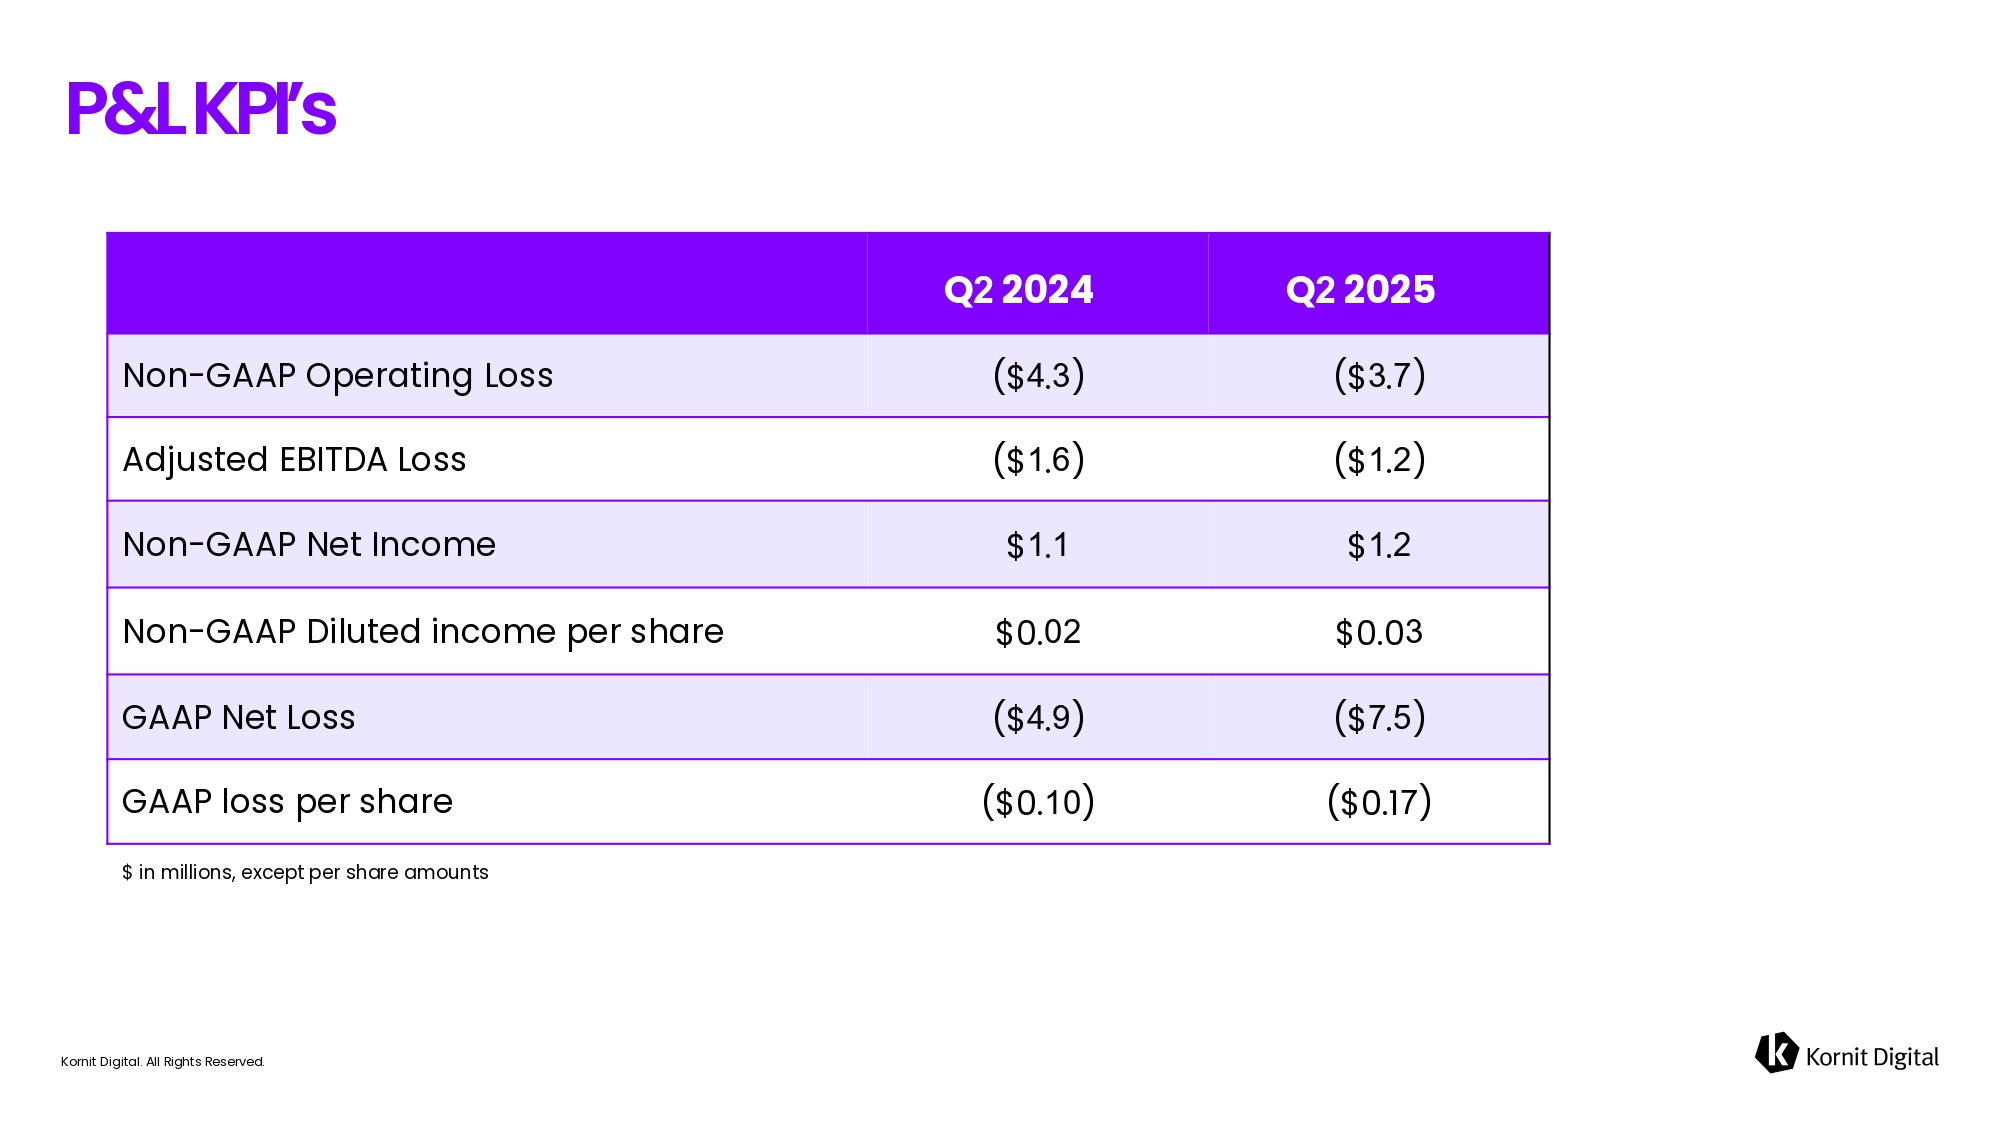
Kornit Digital. All Rights Reserved. P&L KPI’s Q 2025 Q 2024 ($ . ) ($ . ) Non - GAAP Operating Loss ($ . ) ($ . ) Adjusted EBITDA Loss $ . $ . Non - GAAP Net Income $ 0.0 $ 0. Non - GAAP Diluted income per share ($ . ) ($ . ) GAAP Net Loss ($ 0.1 ) ($ 0. ) GAAP loss per share $ in millions, except per share amounts
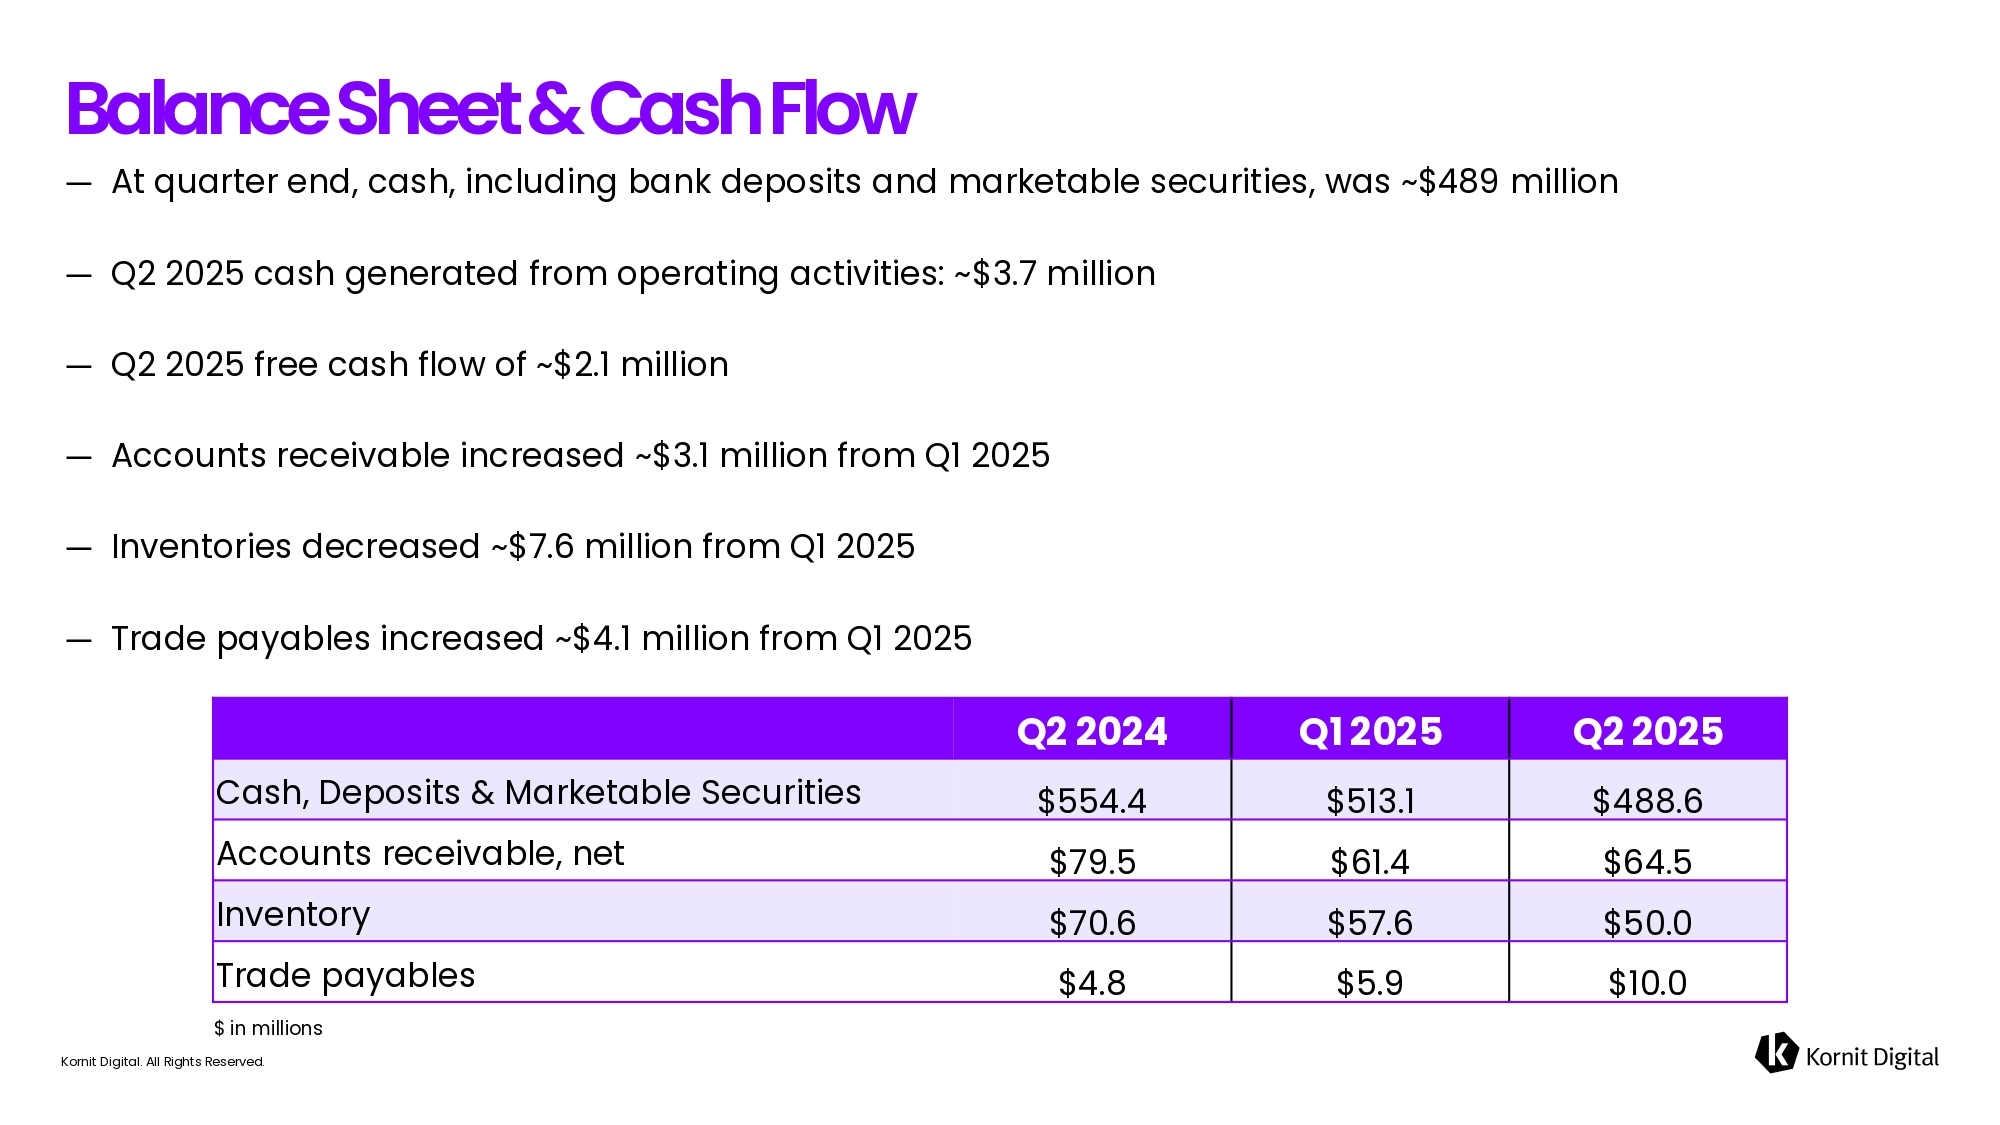
Kornit Digital. All Rights Reserved. ― At quarter end, cash, including bank deposits and marketable securities, was ~$ ʧʫʬ million ― Q ʥ 2025 cash generated from operating activities: ~$ ʦ . ʪ million ― Q ʥ 2025 free cash flow of ~$ ʥ . ʤ million ― Accounts receivable increase d ~$ ʦ .1 million from Q 1 2025 ― Inventories decreased ~$ ʪ . ʩ million from Q ʤ 202 ʨ ― Trade payables increase d ~$ ʧ .1 million from Q ʤ 202 ʨ Balance Sheet & Cash Flow Q2 2025 Q1 2025 Q 2 2024 $488.6 $513.1 $554.4 Cash, Deposits & Marketable Securities $64.5 $61.4 $79.5 Accounts r eceivable, net $50.0 $57.6 $70.6 Inventory $10.0 $5.9 $4.8 Trade p ayables $ in millions
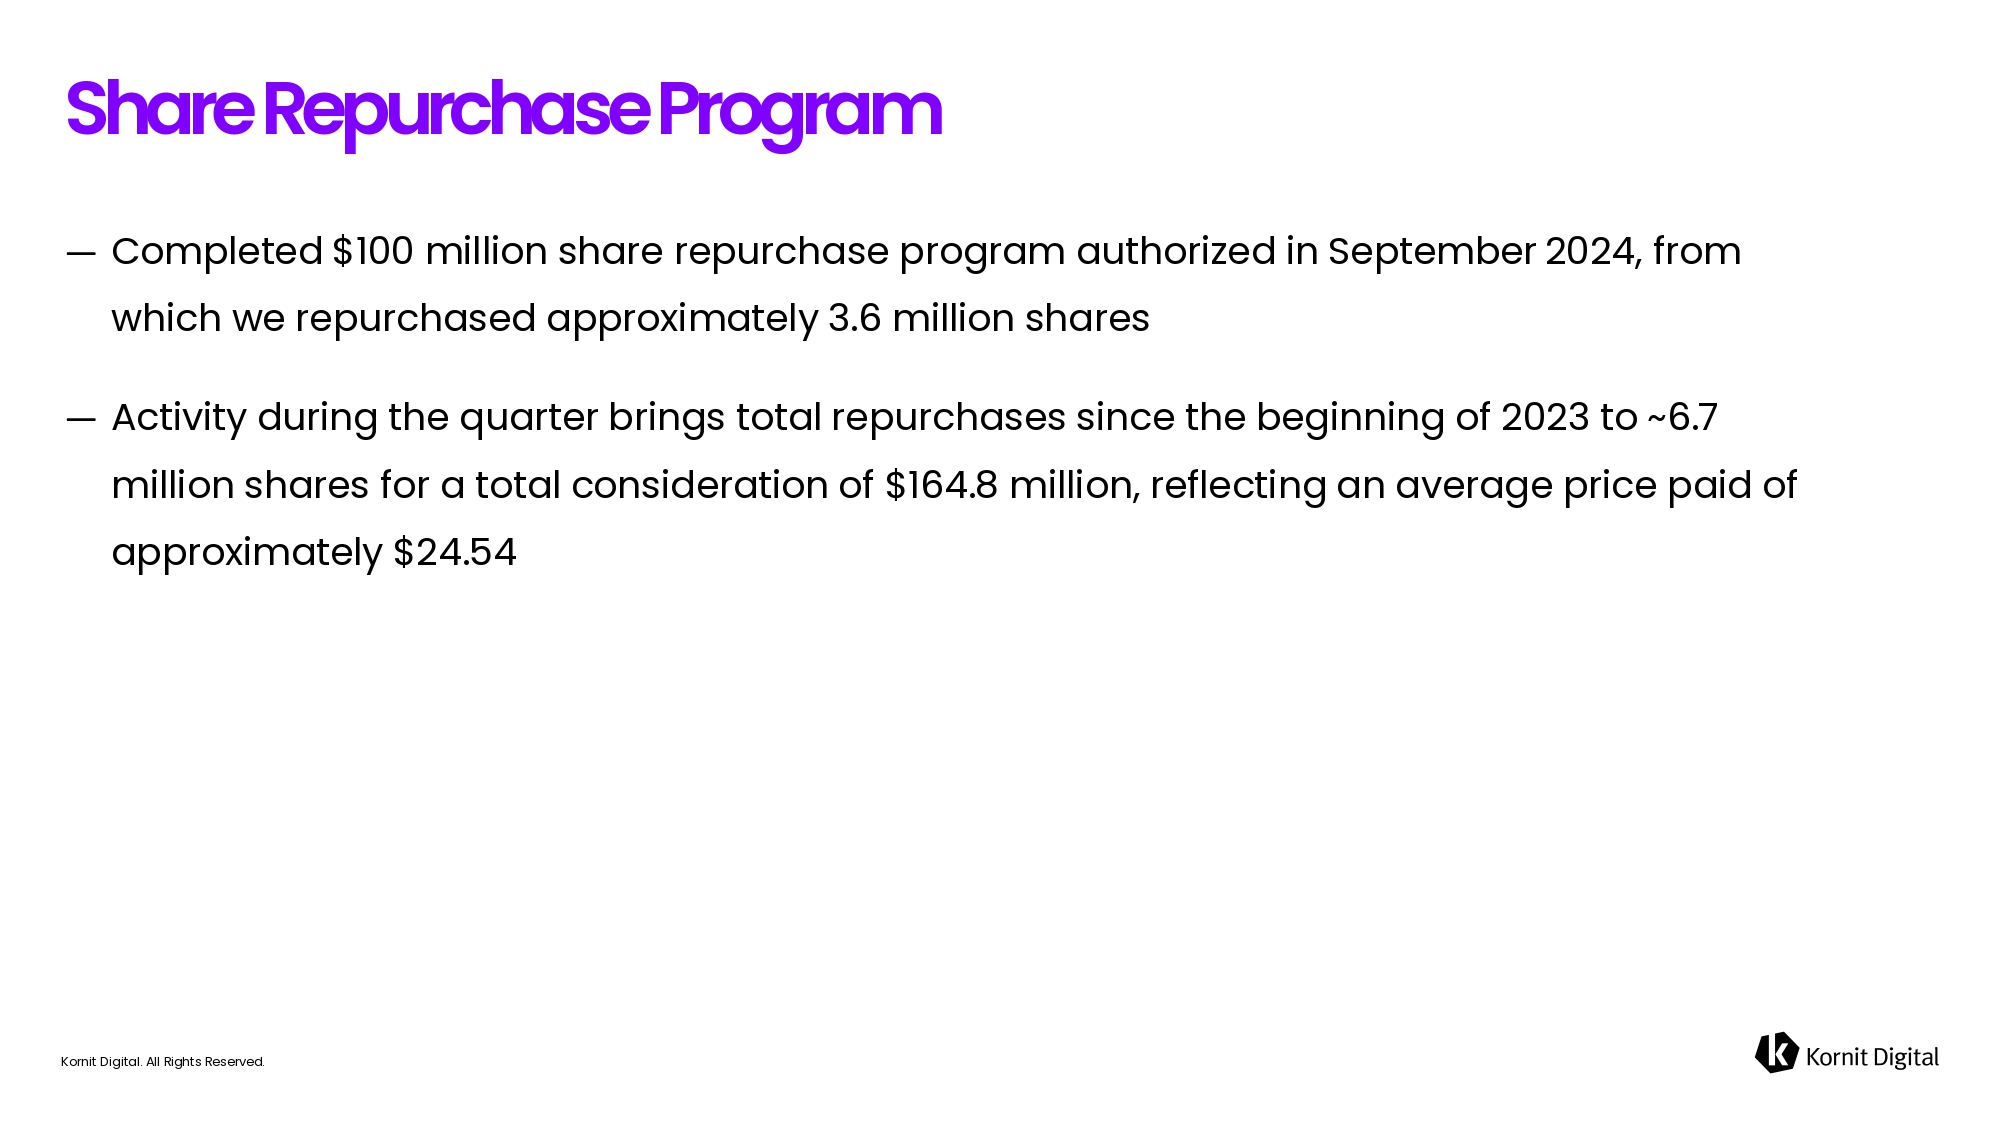
Kornit Digital. All Rights Reserved. ― Completed $100 million share repurchase program authorized in September 2024, from which we repurchased approximately 3.6 million shares ― Activity during the quarter brings total repurchases since the beginning of 2023 to ~6.7 million shares for a total consideration of $164.8 million, reflecting an average price paid of approximately $24.54 Share Repurchase Program
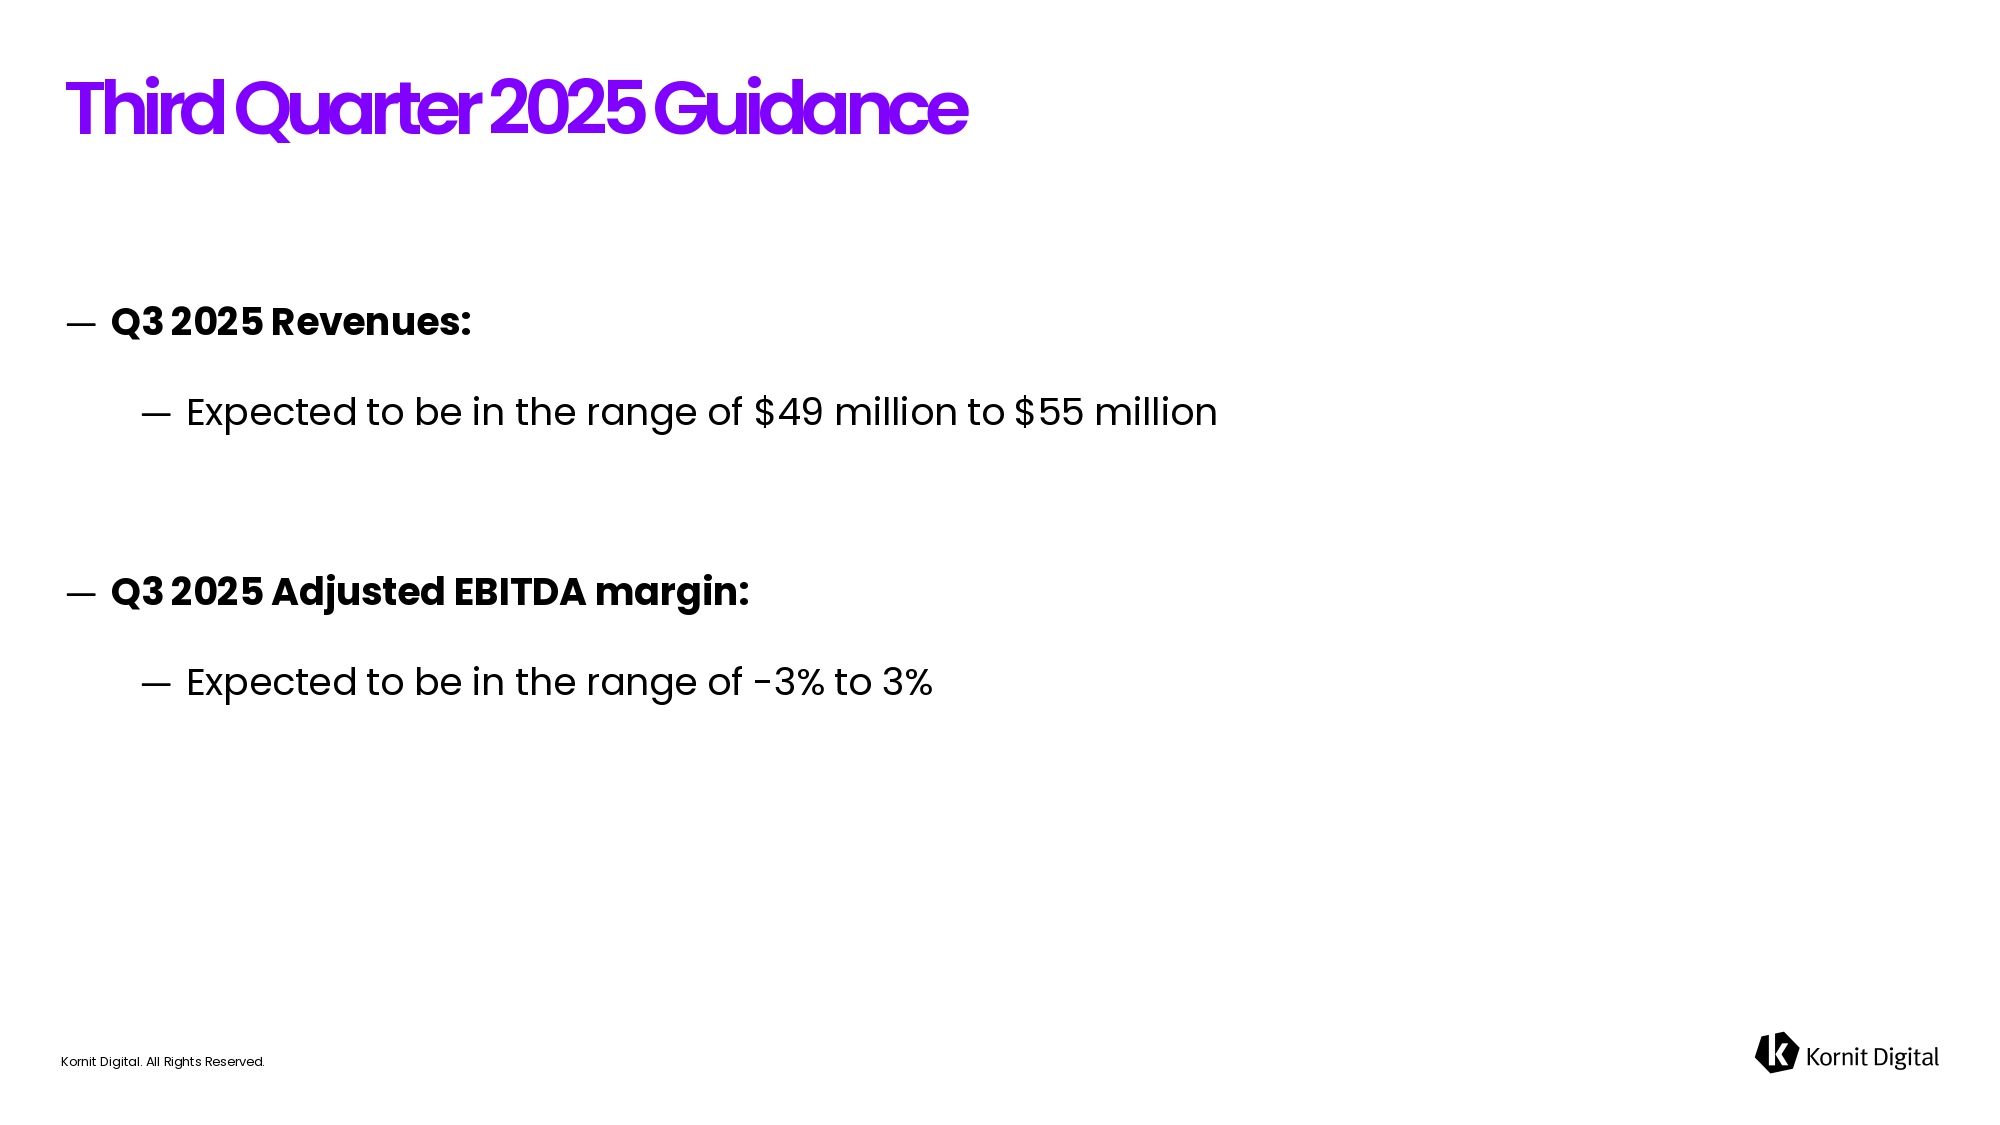
Kornit Digital. All Rights Reserved. ― Q3 2025 Revenues: ― Expected to be in the range of $49 million to $55 million ― Q3 2025 Adjusted EBITDA margin: ― Expected to be in the range of - 3% to 3% Third Quarter 2025 Guidance
Kornit Digital. All Rights Reserved.
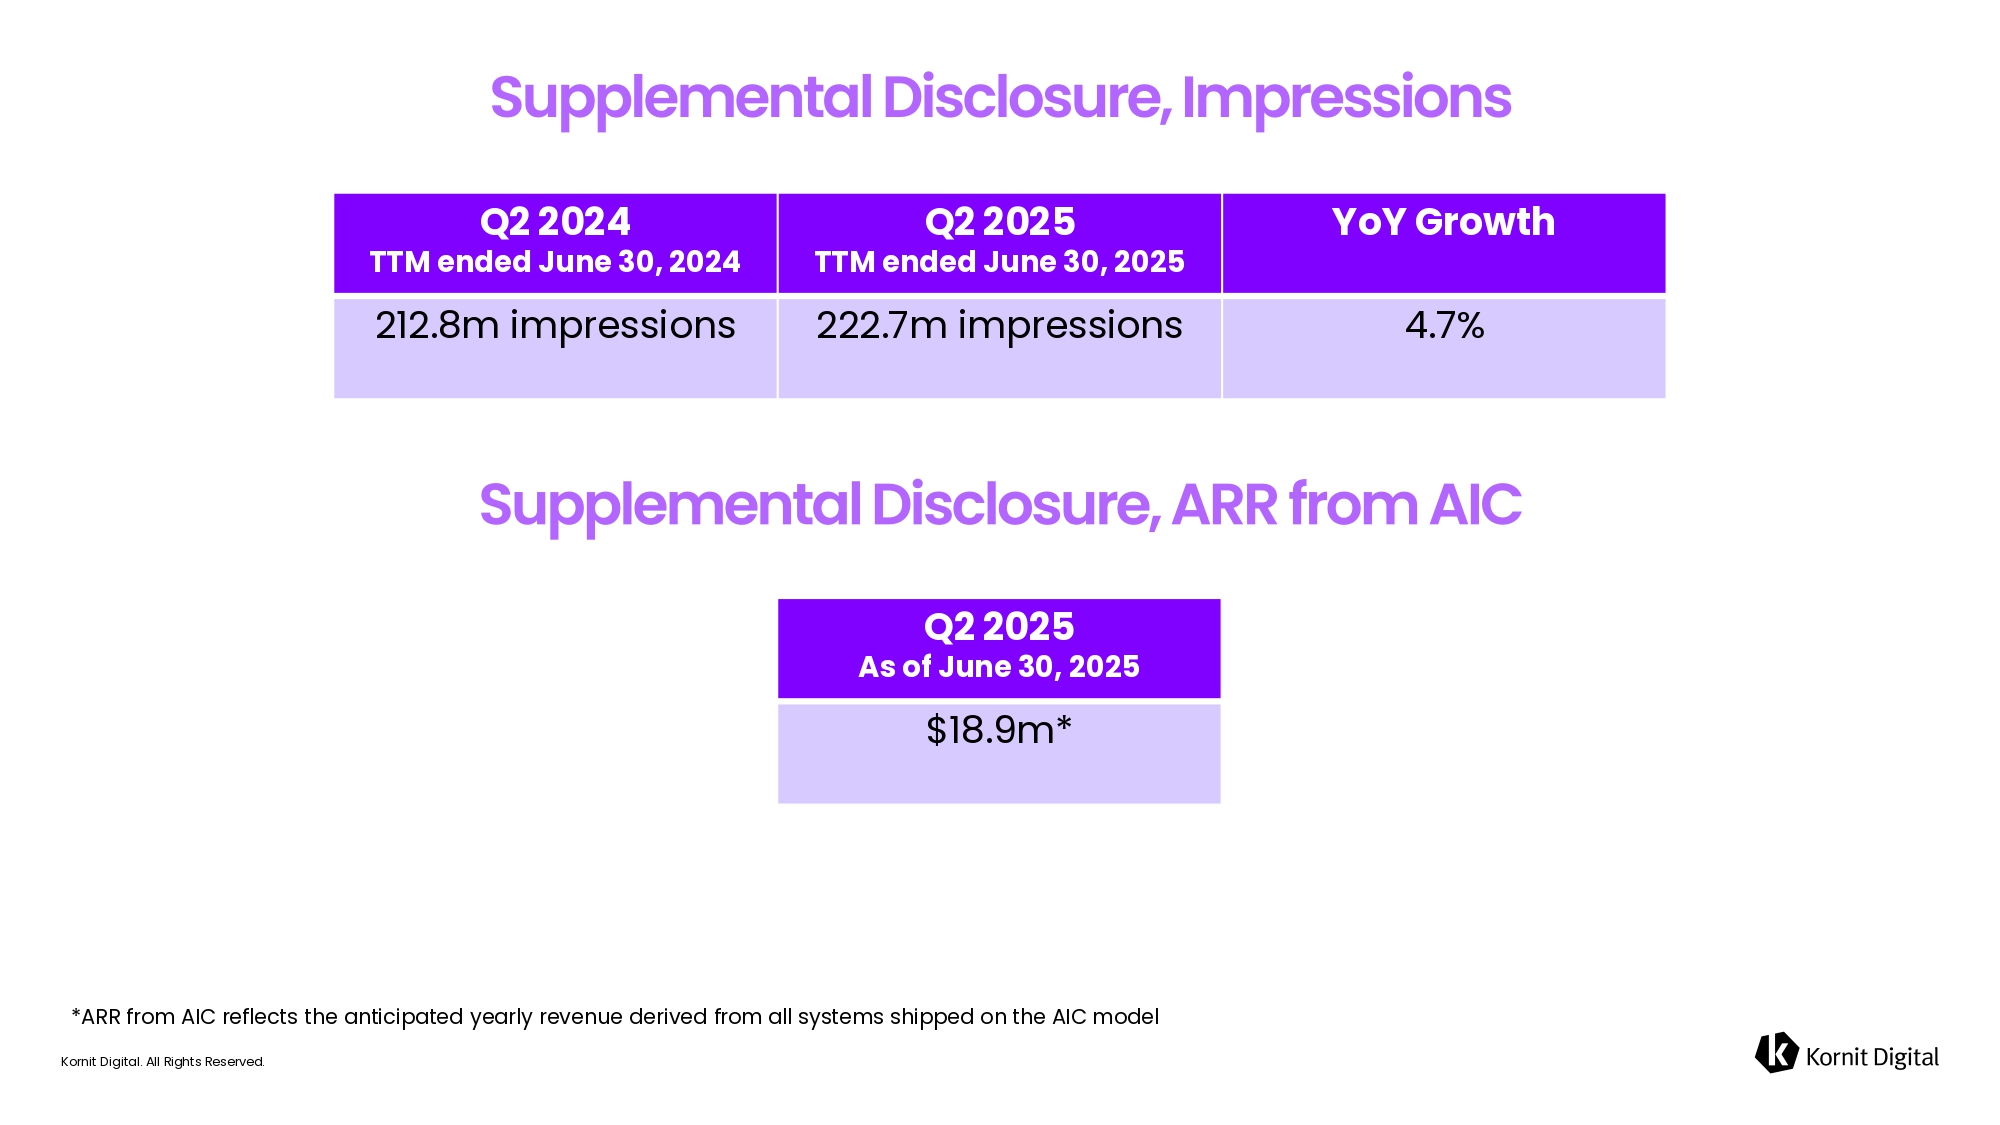
Kornit Digital. All Rights Reserved. YoY Growth Q2 2025 TTM ended June 30, 2025 Q2 2024 TTM ended June 30, 2024 4.7% 222.7m impressions 212.8m impressions Q2 2025 As of June 30, 2025 $18.9m* *ARR from AIC reflects the anticipated yearly revenue derived from all systems shipped on the AIC model

Kornit Digital. All Rights Reserved. Thank You!